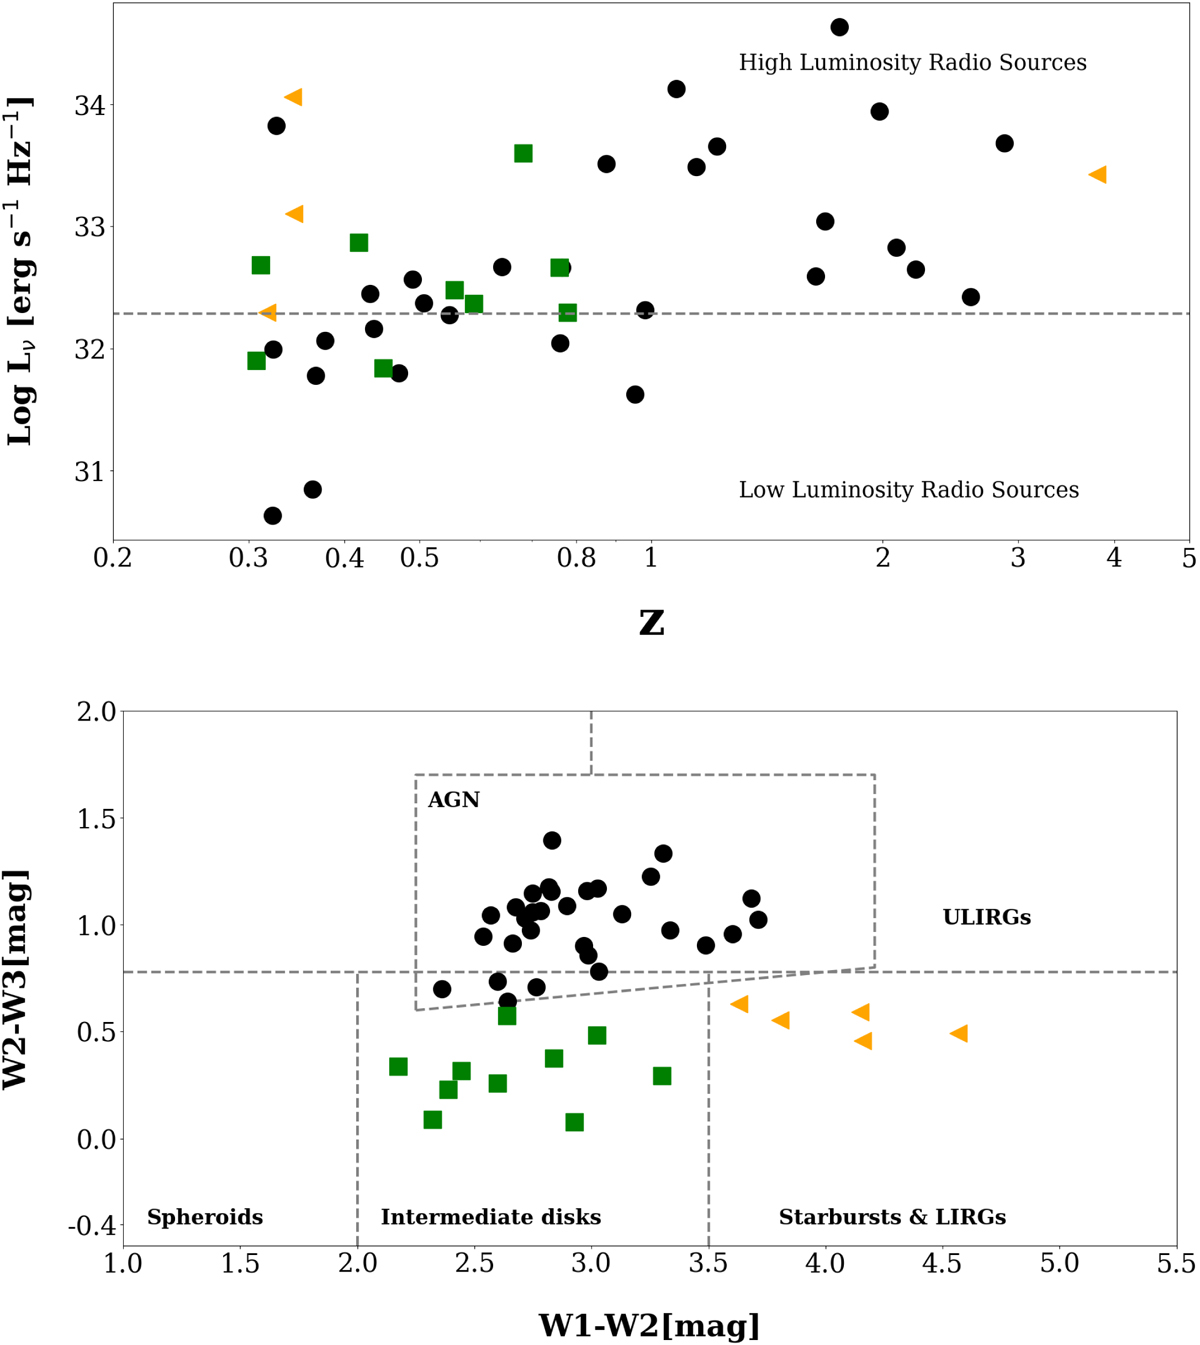
Fig. 1.
Download original image
Radio luminosity densities and infrared colors for the radio sources in our sample. Top. 1.4 GHz Radio luminosity density as a function of redshift. Sources are distinguished between AGN (black circles), starbursts (orange triangles), intermediate disks (green squares), and spheroids according to the color-based classification by Stern et al. (2012) and Jarrett et al. (2017). The horizontal line is at Lν = 2 × 1032 erg s−1 Hz−1 and separates low-luminosity radio sources from high-luminosity radio sources. Bottom. WISE color-color plot. Color coding of the data-points is the same as in the top panel. Black dashed lines are overplotted to distinguish the different types of objects (AGN, ULIRGs, spheroids, intermediate disks, starbusts, and LIRGs).
Current usage metrics show cumulative count of Article Views (full-text article views including HTML views, PDF and ePub downloads, according to the available data) and Abstracts Views on Vision4Press platform.
Data correspond to usage on the plateform after 2015. The current usage metrics is available 48-96 hours after online publication and is updated daily on week days.
Initial download of the metrics may take a while.