Open Access
Fig. 9
Download original image
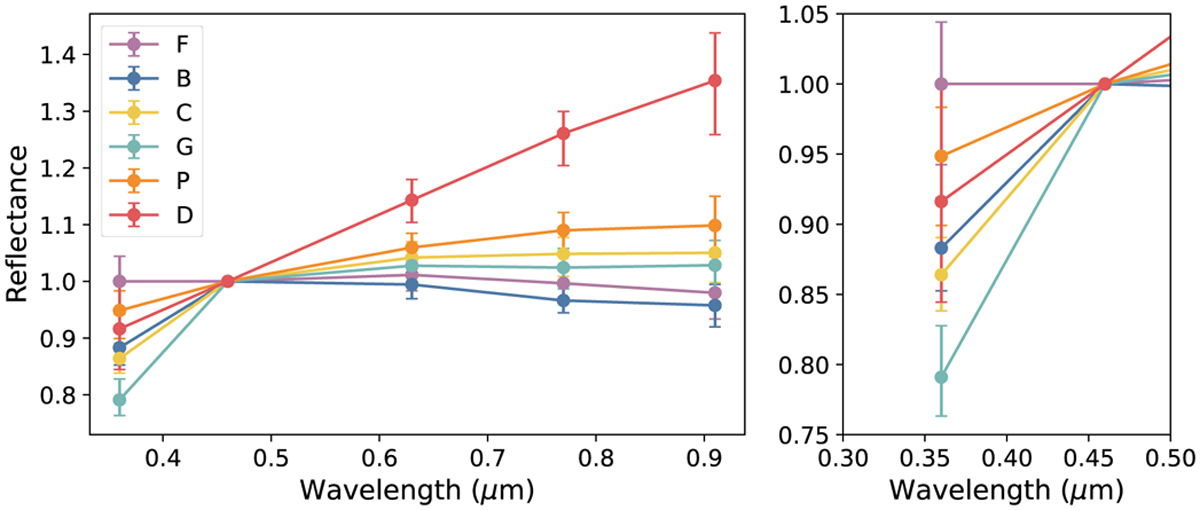
Average spectrophotometry of taxonomic classes through the SDSS filter set classified in Table 3. The error bars show the interquartile range in the taxonomic classes. (Left) Spectra for the entire wave-length of SDSS filters. (Right) Same spectra as in the left panel but within the NUV range.
Current usage metrics show cumulative count of Article Views (full-text article views including HTML views, PDF and ePub downloads, according to the available data) and Abstracts Views on Vision4Press platform.
Data correspond to usage on the plateform after 2015. The current usage metrics is available 48-96 hours after online publication and is updated daily on week days.
Initial download of the metrics may take a while.