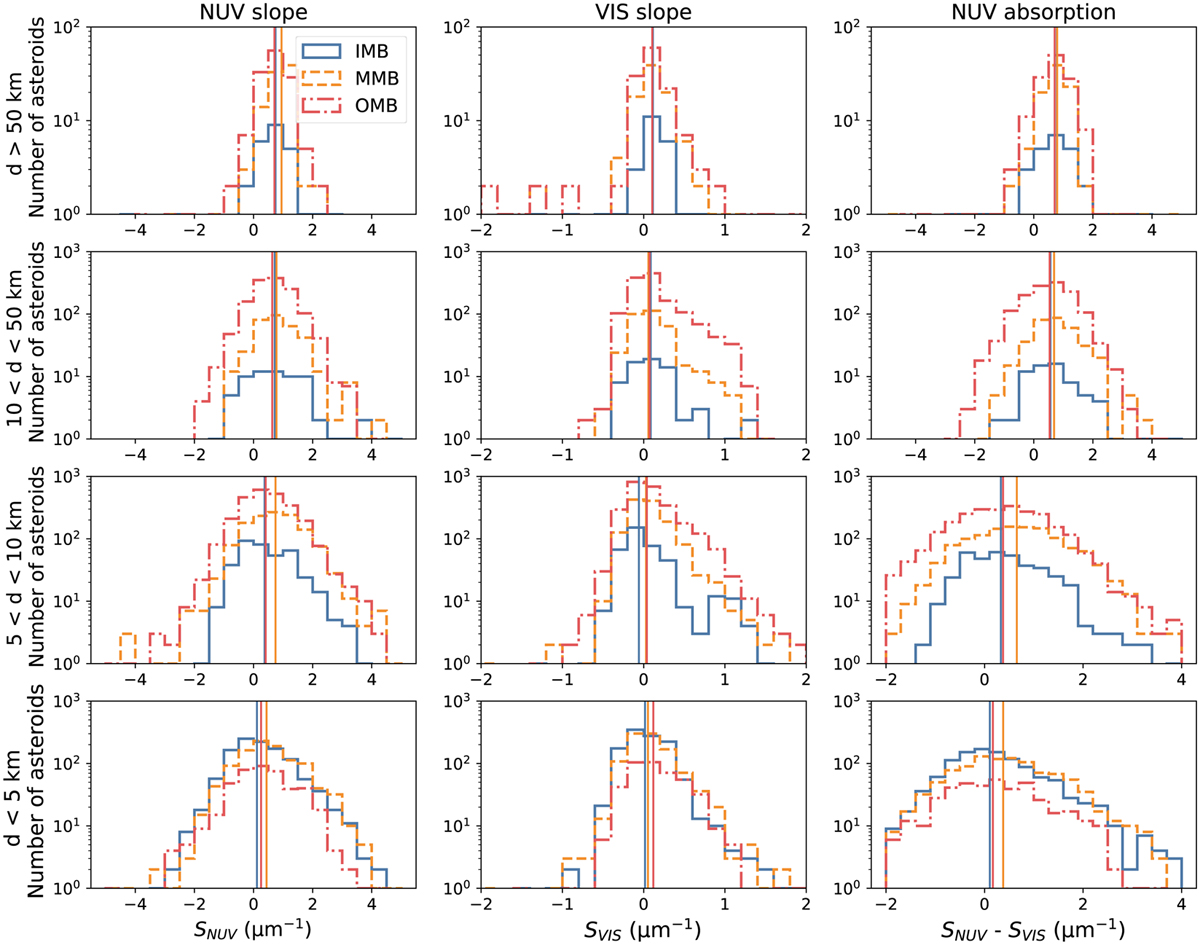
Fig. 7
Download original image
Distribution of spectral slopes among the main asteroid belt. Left column: NUV slope. Middle column: VIS slope. Right column: NUV absorption strength (SNUV – SVIS). The Y axis indicates the number of asteroids in a bin. The blue line is the inner main belt, the yellow line is the middle main belt, and the red line is the outer main belt. The asteroids were divided according to diameter; first row, d > 100 km; second row, 50 < d < 100 km; third row, 10 < d < 50 km; fourth row, 5 < d < 10 km. The vertical lines are the median value for each group.
Current usage metrics show cumulative count of Article Views (full-text article views including HTML views, PDF and ePub downloads, according to the available data) and Abstracts Views on Vision4Press platform.
Data correspond to usage on the plateform after 2015. The current usage metrics is available 48-96 hours after online publication and is updated daily on week days.
Initial download of the metrics may take a while.