Fig. A.3.
Download original image
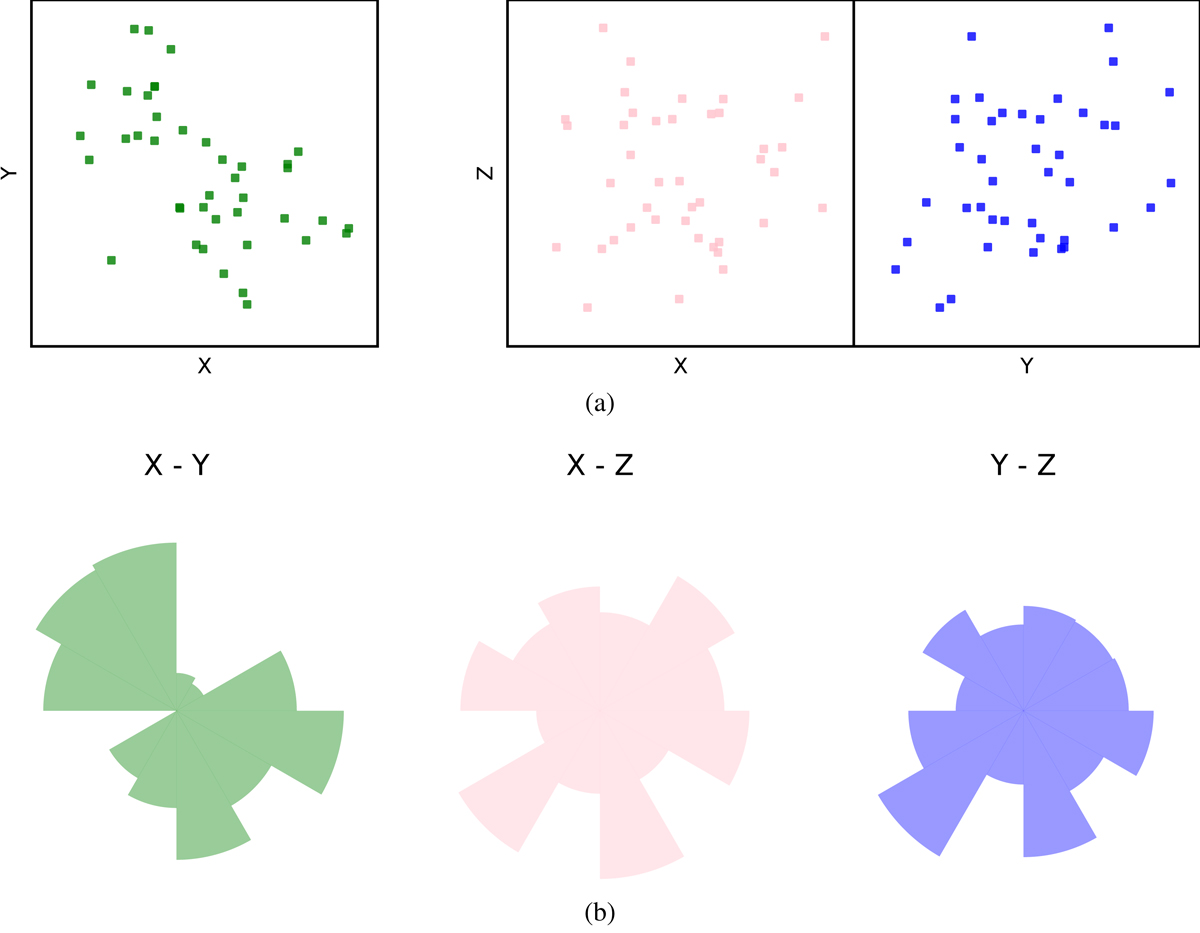
(a) Members’ distributions of the simulated cluster (without a layered structure) on three projection planes. (b) Rose diagrams of the simulated cluster (without a layered structure) on three projection planes. Distributions of stellar members of the simulated cluster (without a layered structure) in the 3D projection planes as well as their rose diagrams in different projection planes. The color information is the same as in panel (b) of Figure 1.
Current usage metrics show cumulative count of Article Views (full-text article views including HTML views, PDF and ePub downloads, according to the available data) and Abstracts Views on Vision4Press platform.
Data correspond to usage on the plateform after 2015. The current usage metrics is available 48-96 hours after online publication and is updated daily on week days.
Initial download of the metrics may take a while.