Fig. 5.
Download original image
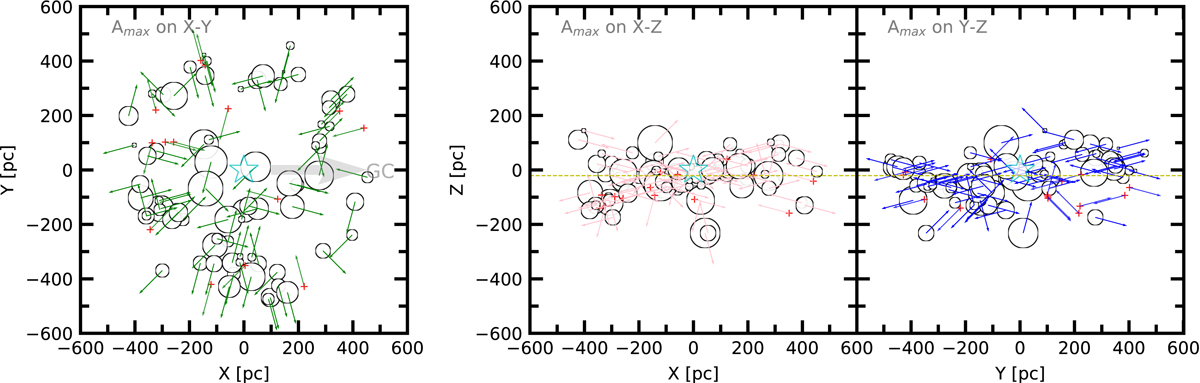
Simple morphological distribution of the sample clusters in the three projection planes. The size of open circles is proportional to the circle core area (s) of the sample clusters in each projection plane. All colored arrows mark the maximum stretch directions (Amax) of the sample clusters in each projection plane. The red crosses in each panel represent sample clusters without a layered structure. The open cyan pentagram in each panel denotes the Sun and the thick gray arrow in the left panel indicates the direction of the Galactic center. The dashed yellow line (Z = −20.8 pc) in the middle and right panel is designed as the Galactic midplane of the Milky Way. For more details, see Sect. 2.1.
Current usage metrics show cumulative count of Article Views (full-text article views including HTML views, PDF and ePub downloads, according to the available data) and Abstracts Views on Vision4Press platform.
Data correspond to usage on the plateform after 2015. The current usage metrics is available 48-96 hours after online publication and is updated daily on week days.
Initial download of the metrics may take a while.