Fig. 2.
Download original image
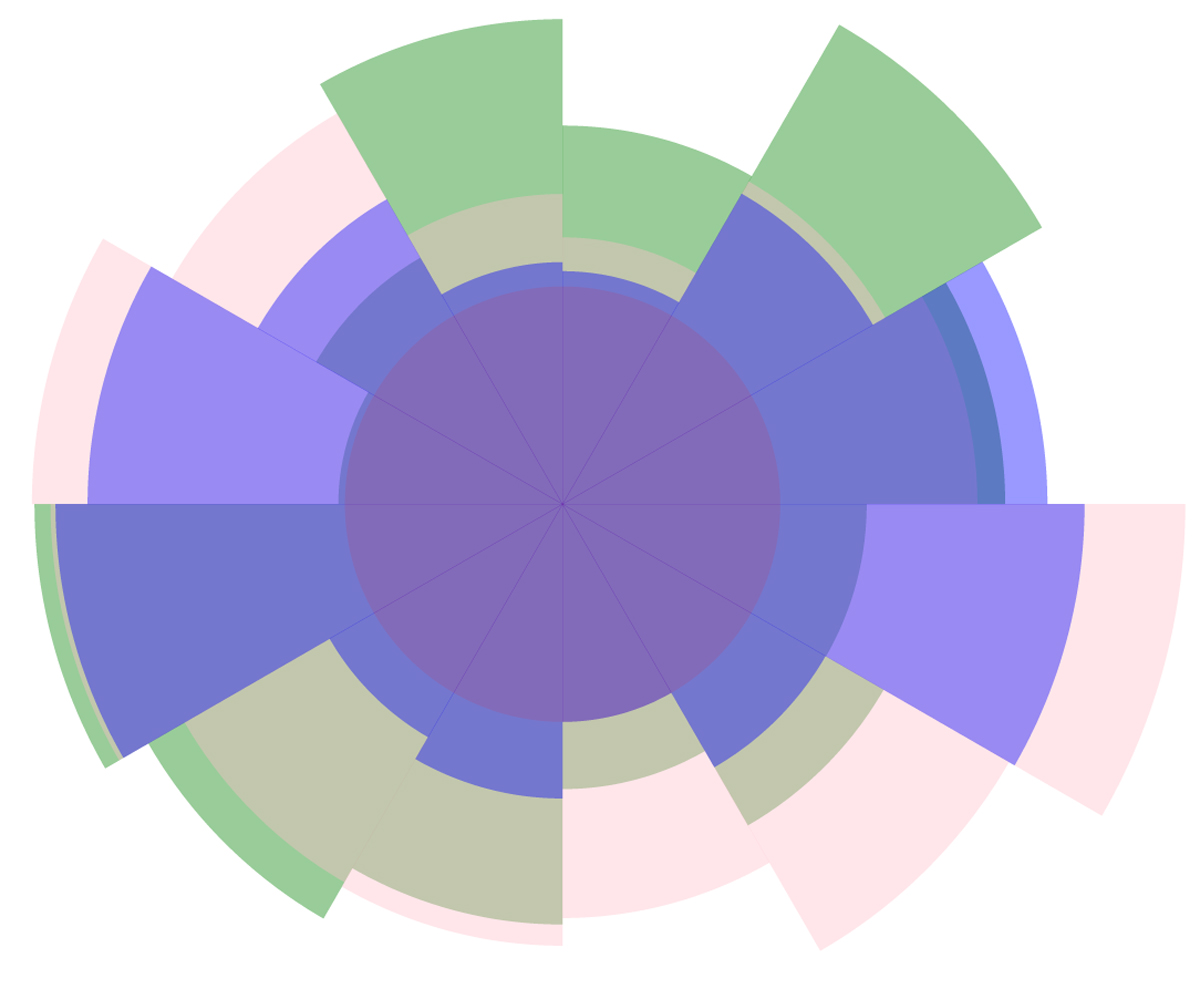
Overlaid rose diagram of the cluster (Gulliver 20). There are three different rose diagrams (see Sect. 2.1 for more details about constructing them) on the projection planes in the heliocentric Cartesian coordinate system before overlaying, with the X–Y plane (green), X–Z plane (pink), and Y–Z plane (blue). The circle region in dark purple represents the circle core of the cluster in a layered structure, while the region in dark blue represents its irregular core.
Current usage metrics show cumulative count of Article Views (full-text article views including HTML views, PDF and ePub downloads, according to the available data) and Abstracts Views on Vision4Press platform.
Data correspond to usage on the plateform after 2015. The current usage metrics is available 48-96 hours after online publication and is updated daily on week days.
Initial download of the metrics may take a while.