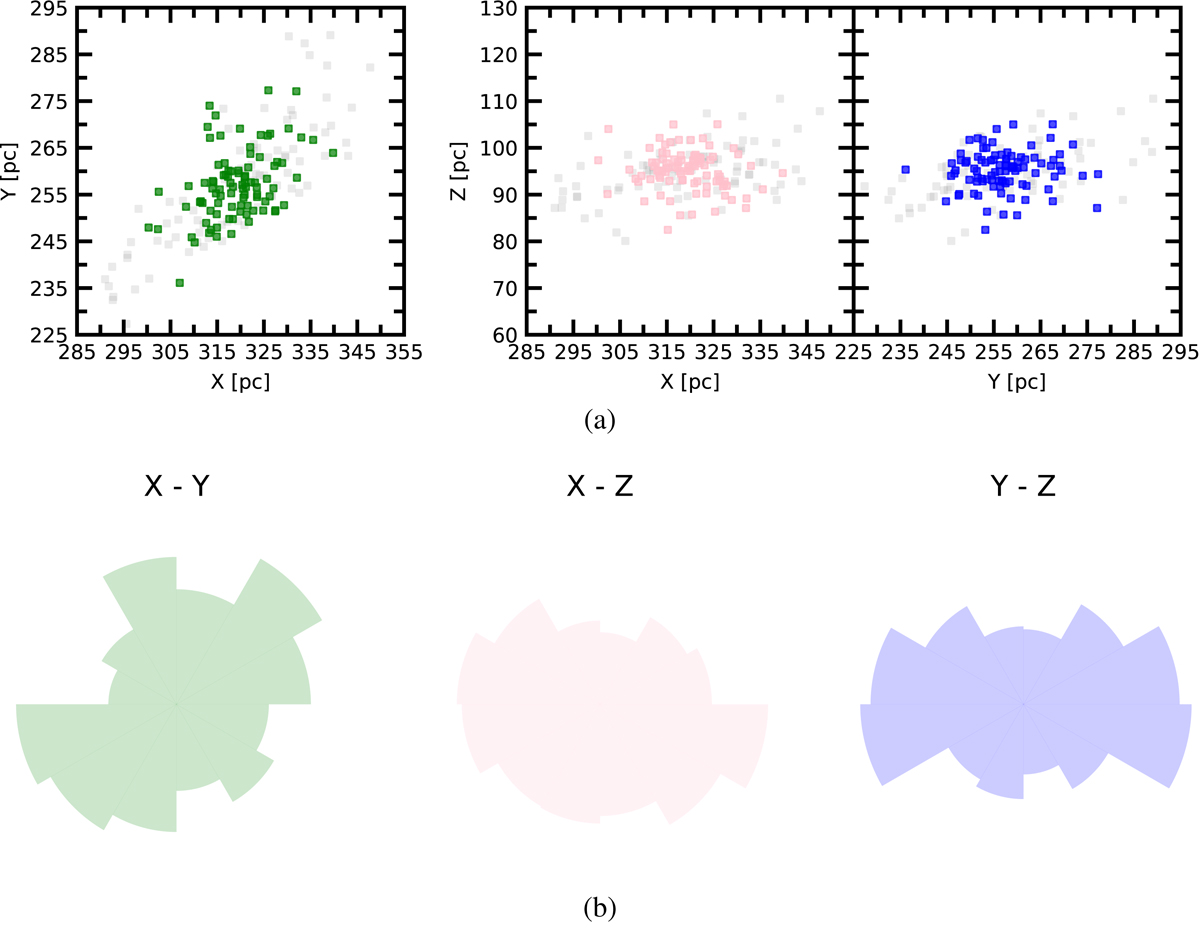
Fig. 1.
Download original image
(a) Members’ distributions of the Gulliver 20 cluster on three projection planes after and before correcting distances. (b) Rose diagrams of the Gulliver 20 cluster on three projection planes after correcting distances. Distributions of stellar members of Gulliver 20 in the 3D projection planes as well as their rose diagrams in different projection planes. Upper panel: All colored dots in each panel represent the stellar members of the cluster (Gulliver 20) after distance correction. The gray dots in the background in each panel show the spatial distribution of all members of the cluster without distance correction. Bottom: Three different rose diagrams including the green rose diagram (X–Y plane), pink rose diagram (X–Z plane), and blue rose diagram (Y–Z plane).
Current usage metrics show cumulative count of Article Views (full-text article views including HTML views, PDF and ePub downloads, according to the available data) and Abstracts Views on Vision4Press platform.
Data correspond to usage on the plateform after 2015. The current usage metrics is available 48-96 hours after online publication and is updated daily on week days.
Initial download of the metrics may take a while.