Open Access
Fig. 5.
Download original image
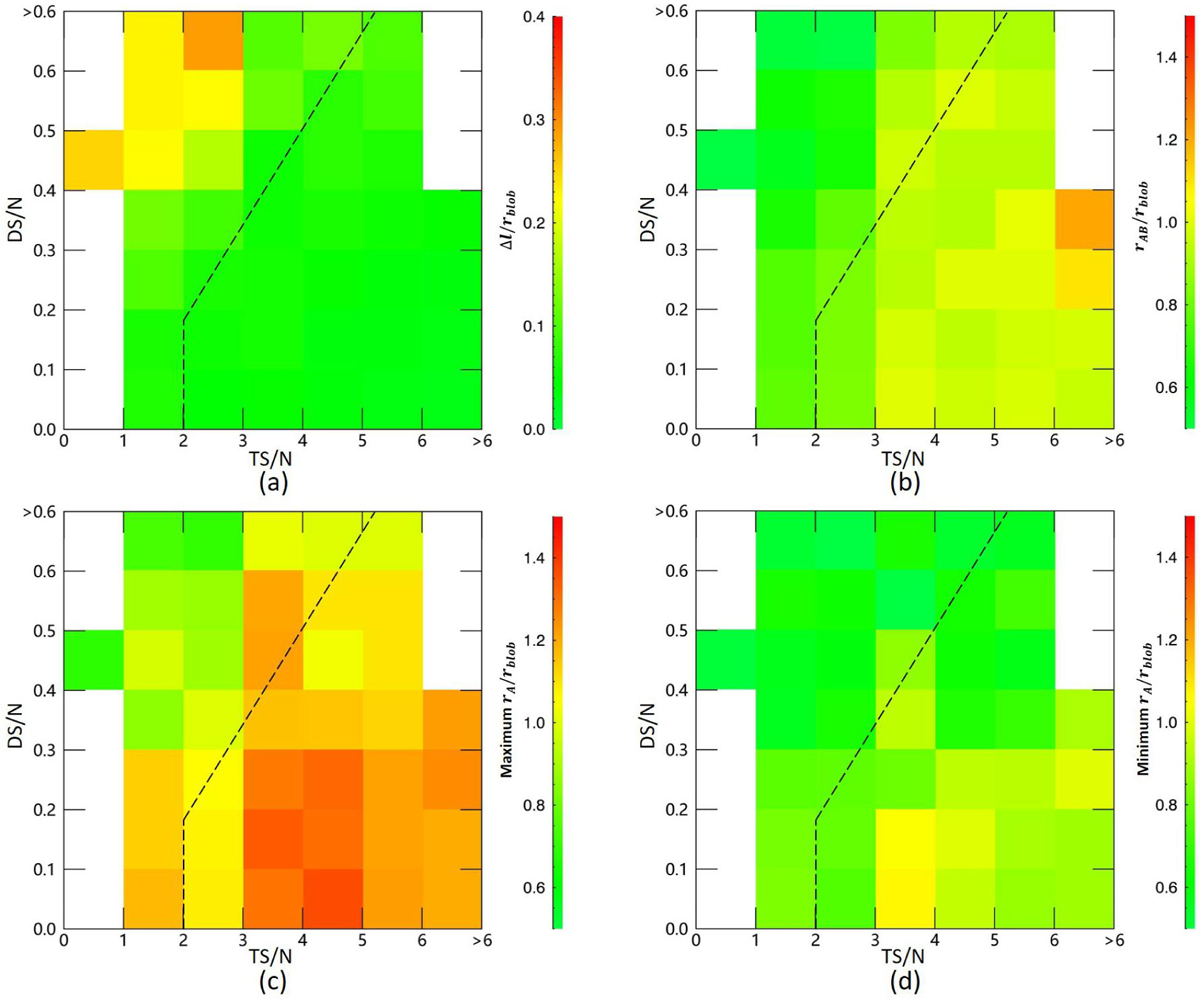
Two-dimensional distribution of (a) Δl, (b) rAB, (c) maximum rA, and (d) minimum rA of the nonSSE blobs as a function of TS/N and DS/N when θSun is 135°. The black dashed lines mark the boundaries of the regions satisfying the inequality (6).
Current usage metrics show cumulative count of Article Views (full-text article views including HTML views, PDF and ePub downloads, according to the available data) and Abstracts Views on Vision4Press platform.
Data correspond to usage on the plateform after 2015. The current usage metrics is available 48-96 hours after online publication and is updated daily on week days.
Initial download of the metrics may take a while.