Open Access
Fig. 8.
Download original image
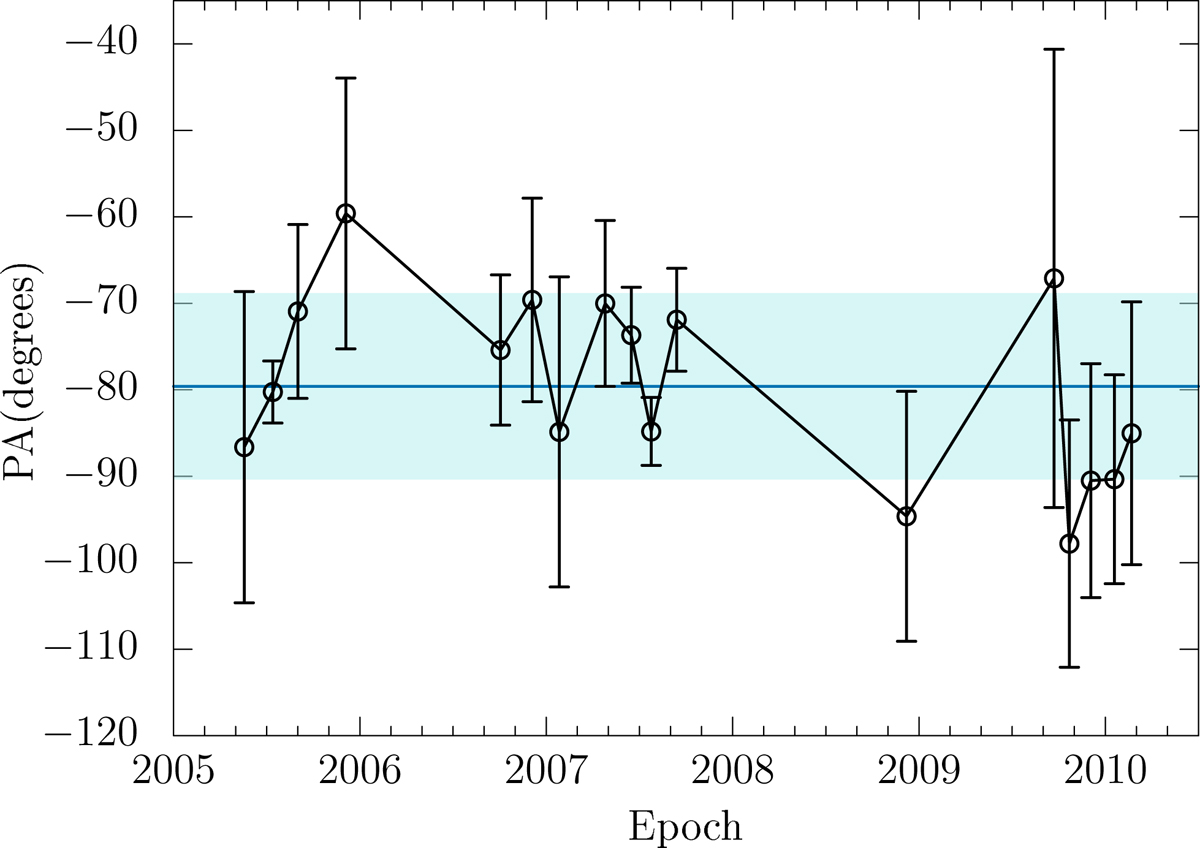
Time variability of the jet position angle (PA) from the model fitting to the core. The PA values (black open circles) represent the average PA per epoch using all core-shift vectors per frequency pair (CX, XU, UK, KQ). The blue line is the mean PA for the whole data set. The area in light cyan represents ±1σ.
Current usage metrics show cumulative count of Article Views (full-text article views including HTML views, PDF and ePub downloads, according to the available data) and Abstracts Views on Vision4Press platform.
Data correspond to usage on the plateform after 2015. The current usage metrics is available 48-96 hours after online publication and is updated daily on week days.
Initial download of the metrics may take a while.