Fig. 7.
Download original image
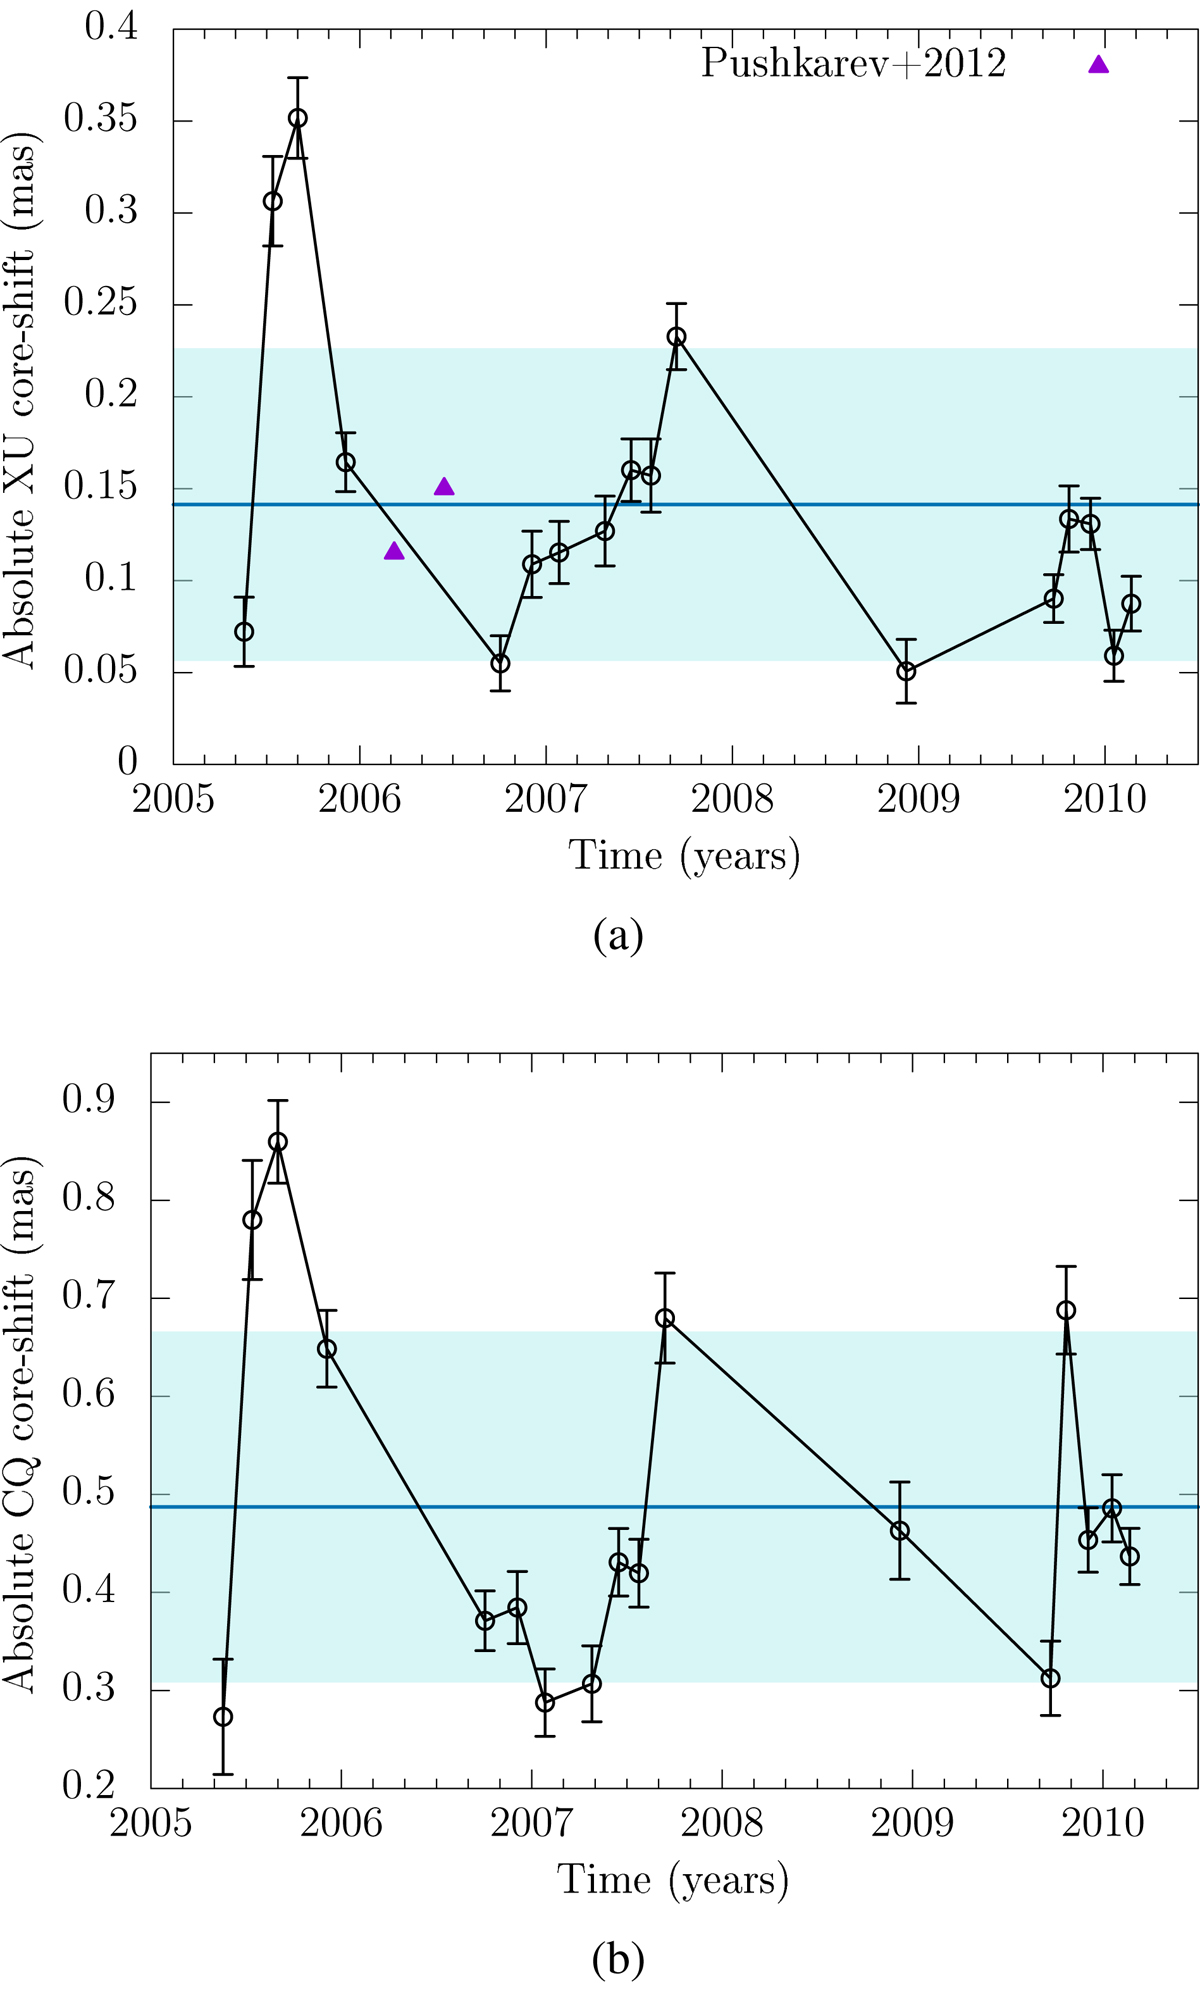
Variability of the core shift in 3C 454.3. (a) Core shift between the X (8 GHz) and U (15 GHz) bands vs. time. The purple triangles represent the core shifts derived by Pushkarev et al. (2012). (b) Core shift between the C (5 GHz) and Q (43 GHz) bands vs. time. In both panels the mean value is represented by the blue line and ±σ is displayed by the shaded cyan background. The epoch 2008 January 03, which had three missing antennas, was dropped from this plot as an outlier with a CQ core shift of 1.64 ± 0.04 mas. Zero core shift physically means that the cores at two frequencies coincide at the same location.
Current usage metrics show cumulative count of Article Views (full-text article views including HTML views, PDF and ePub downloads, according to the available data) and Abstracts Views on Vision4Press platform.
Data correspond to usage on the plateform after 2015. The current usage metrics is available 48-96 hours after online publication and is updated daily on week days.
Initial download of the metrics may take a while.