Fig. 6.
Download original image
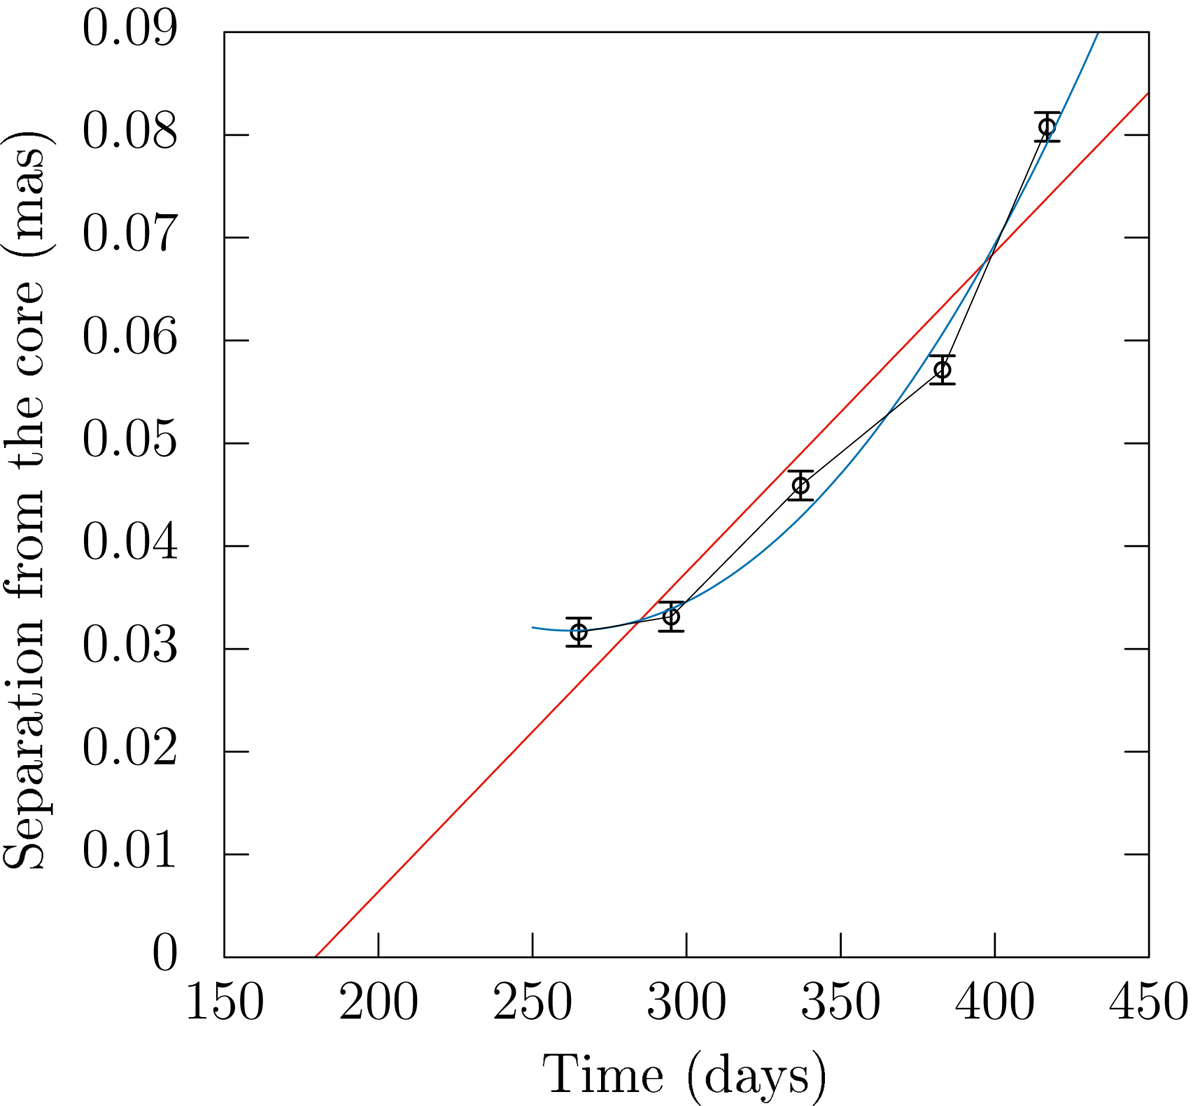
Separation of the moving feature (see Fig. 4) from the core as a function of time at 43 GHz. The first day is counted from 2009 January 01. The black circles indicate the observations on 2009 September 22, 2009 October 22, 2009 December 03, 2010 January 18, and 2010 February 21. The red and blue curves indicate linear and accelerating fitting functions, respectively.
Current usage metrics show cumulative count of Article Views (full-text article views including HTML views, PDF and ePub downloads, according to the available data) and Abstracts Views on Vision4Press platform.
Data correspond to usage on the plateform after 2015. The current usage metrics is available 48-96 hours after online publication and is updated daily on week days.
Initial download of the metrics may take a while.