Fig. 4.
Download original image
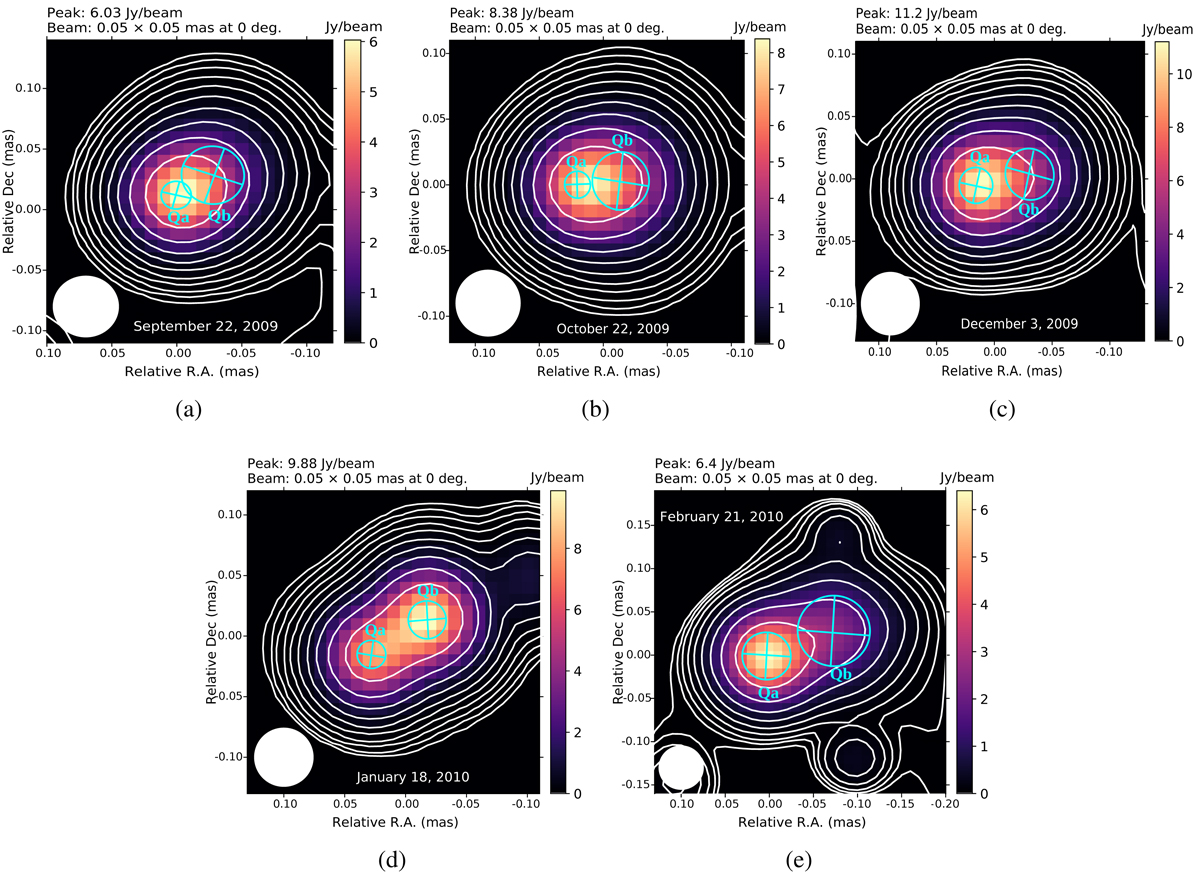
Super-resolved images of 3C 454.3 at 43 GHz for five different epochs from 2009 to 2010. The contours are given at 0.1%, 0.2%, 0.4%, 0.8%, 1.6%, 3.2%, 6.4%, 12.8%, 25.6%, and 51.2% of the peak intensity at each image. Each map uses a circular convolving beam of 0.05 mas and the components are displayed in cyan. The restoring beam (circular) is displayed in the bottom left corner of each image. The rms noise level is in (a) 1.1, (b) 2.4, (c) 4.1, (d) 7.7, and (e) 2.9 mJy beam−1. The core labelled ‘Qa’ and ‘Qb’ denotes a bright, recently ejected component that is moving downstream.
Current usage metrics show cumulative count of Article Views (full-text article views including HTML views, PDF and ePub downloads, according to the available data) and Abstracts Views on Vision4Press platform.
Data correspond to usage on the plateform after 2015. The current usage metrics is available 48-96 hours after online publication and is updated daily on week days.
Initial download of the metrics may take a while.