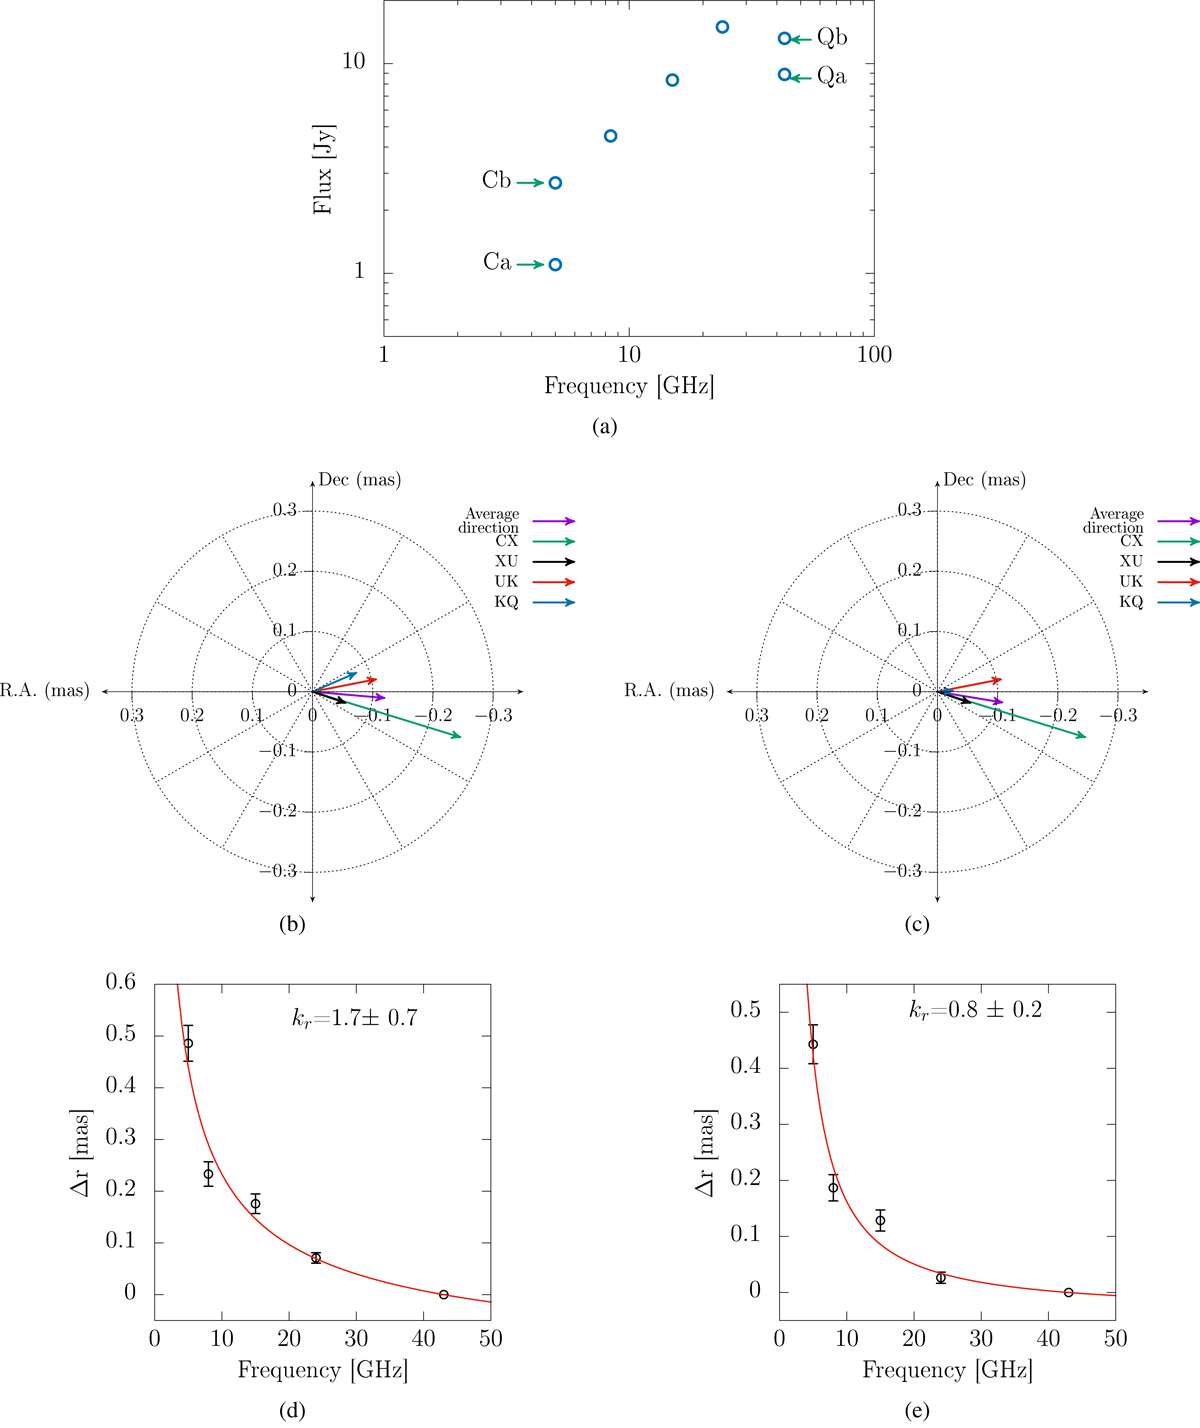
Fig. D.17.
Download original image
Epoch 18, 2010 January 18. a) Core spectrum, where Cb and Qa represent the core at the C and Q bands. Qb is the feature moving downstream. For comparisons, see Figure 4d. Core-shift vectors of all frequency pairs using b) Qa and c) Qb. Similarly, as in the previous epoch, the two components have a similar impact on the direction of KQ core-shift vector. Power-law fits (red curve) using d) Qa and e) Qb. Again, the flare appears to hinder the correct location of the core at the Q band (43 GHz). The effect is less pronounced than in the previous epoch, but it disorders the core-shift effect by increasing the core-shift values at the high frequencies, as seen in d).
Current usage metrics show cumulative count of Article Views (full-text article views including HTML views, PDF and ePub downloads, according to the available data) and Abstracts Views on Vision4Press platform.
Data correspond to usage on the plateform after 2015. The current usage metrics is available 48-96 hours after online publication and is updated daily on week days.
Initial download of the metrics may take a while.