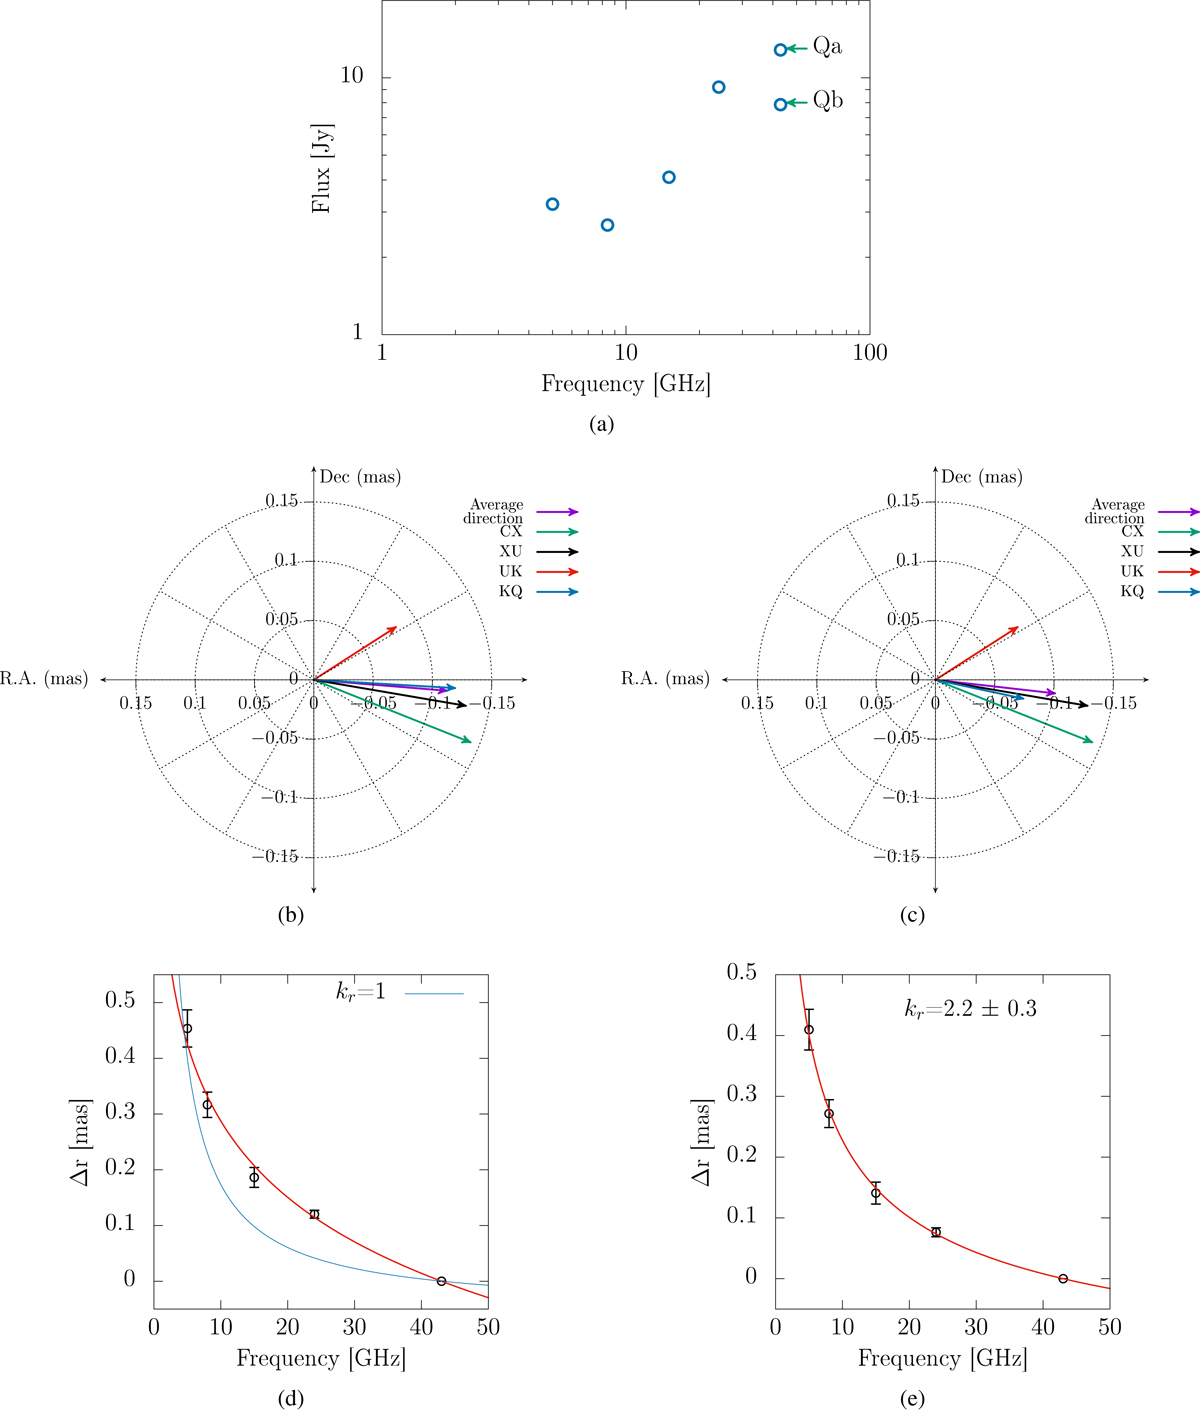
Fig. D.16.
Download original image
Epoch 17, 2009 December 03. a) Core spectrum, where Qa represents the core and Qb the feature moving downstream. For comparisons, see Figure 4c. Core-shift vectors of all frequency pairs using b) Qa and c) Qb. Similarly, as in the previous epoch, the two components have a similar impact on the direction of KQ core-shift vector. Power-law fits (red curve) using d) Qa and e) Qb. In this epoch the flare appears to hinder the correct location of the core at the Q-band (43 GHz). This ultimately disrupts the core-shift effect by increasing the core-shift values at the high frequencies, as seen in d). Therefore, this observation is not included in the variability analysis of index kr.
Current usage metrics show cumulative count of Article Views (full-text article views including HTML views, PDF and ePub downloads, according to the available data) and Abstracts Views on Vision4Press platform.
Data correspond to usage on the plateform after 2015. The current usage metrics is available 48-96 hours after online publication and is updated daily on week days.
Initial download of the metrics may take a while.