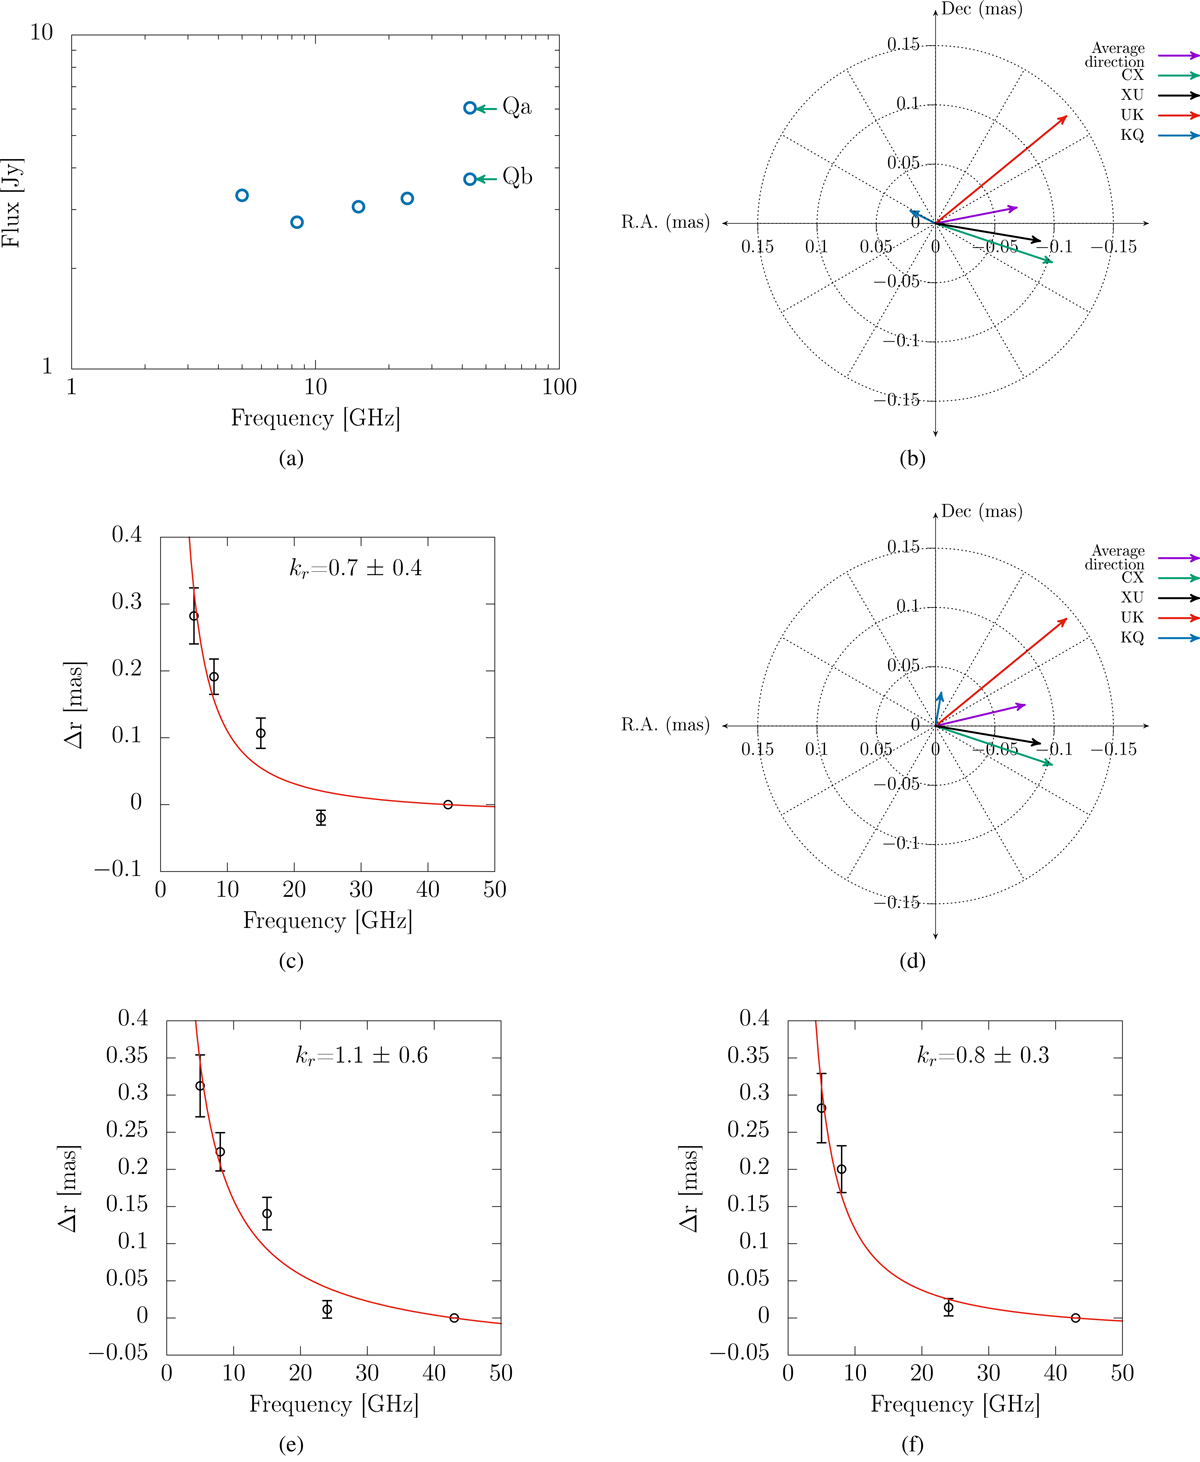
Fig. D.14.
Download original image
Epoch 15, 2009 September 22. a) Core spectrum, where Qa represents the core and Qb the feature moving downstream. For comparisons, see Figure 4a. b) Core-shift vectors of all frequency pairs. Using component Qb makes the KQ core-shift vector point in the opposite direction. c) Power-law fit (red curve) using the Qb component. d) Core-shift vectors of all frequency pairs. Using component Qa, labelled as the core, gives a reasonable direction of the KQ core-shift vector. e) Power-law fit (red curve) using Qa as the core, but a better fit is obtained f) when the U band is excluded.
Current usage metrics show cumulative count of Article Views (full-text article views including HTML views, PDF and ePub downloads, according to the available data) and Abstracts Views on Vision4Press platform.
Data correspond to usage on the plateform after 2015. The current usage metrics is available 48-96 hours after online publication and is updated daily on week days.
Initial download of the metrics may take a while.