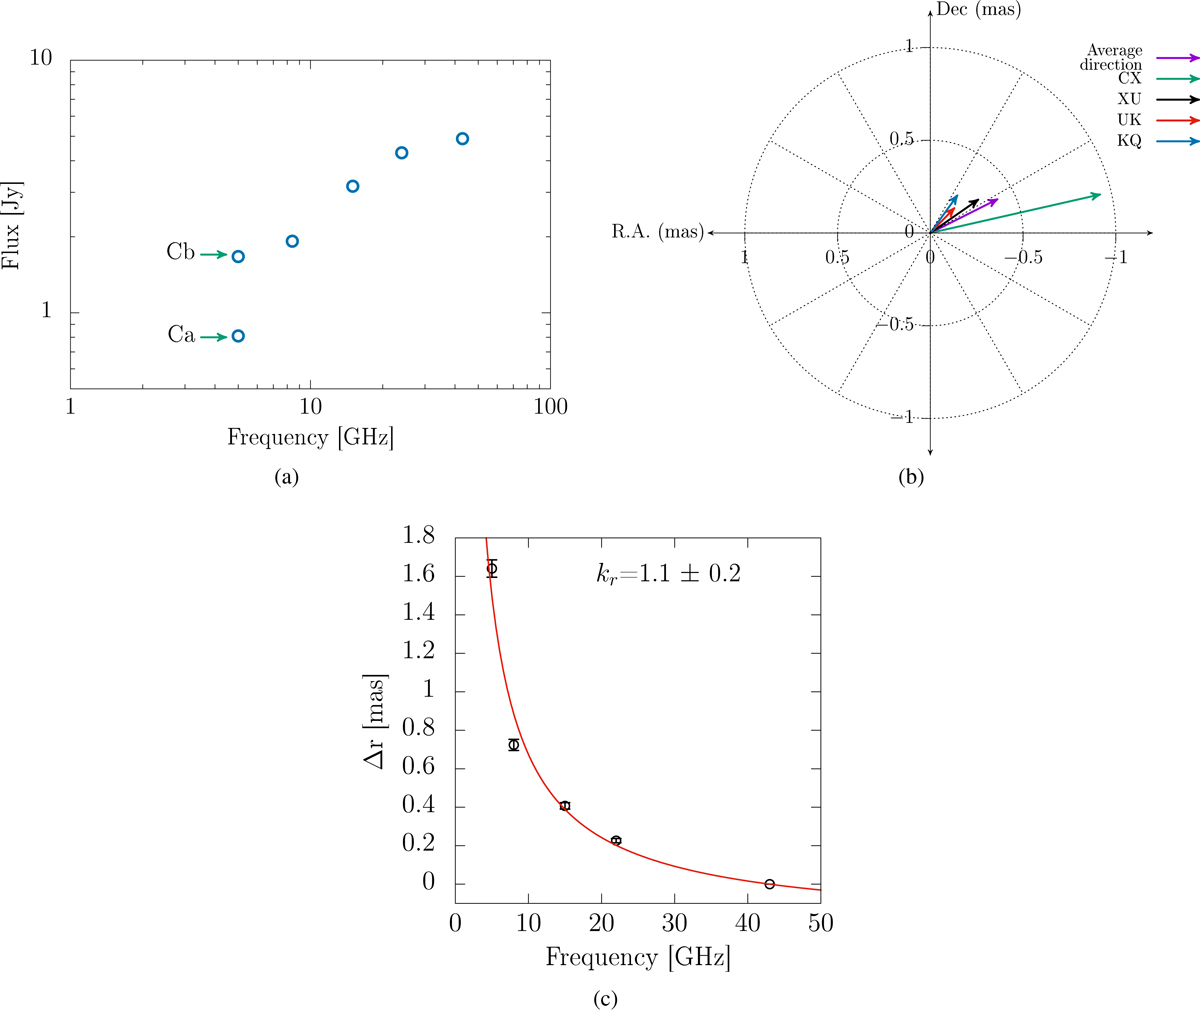
Fig. D.12.
Download original image
Epoch 13, 2008 January 03. (a) Core spectrum, Cb possibly represents the core. (b) Core-shift vectors of all frequency pairs. (c) Power-law fit is shown with the red curve. Due to the poor (u, v) coverage, the core at the C band cannot be well resolved, producing ambiguities on its location. As a result, very large core-shift values above 1 mas were measured. This observation was not included in the variability analysis.
Current usage metrics show cumulative count of Article Views (full-text article views including HTML views, PDF and ePub downloads, according to the available data) and Abstracts Views on Vision4Press platform.
Data correspond to usage on the plateform after 2015. The current usage metrics is available 48-96 hours after online publication and is updated daily on week days.
Initial download of the metrics may take a while.