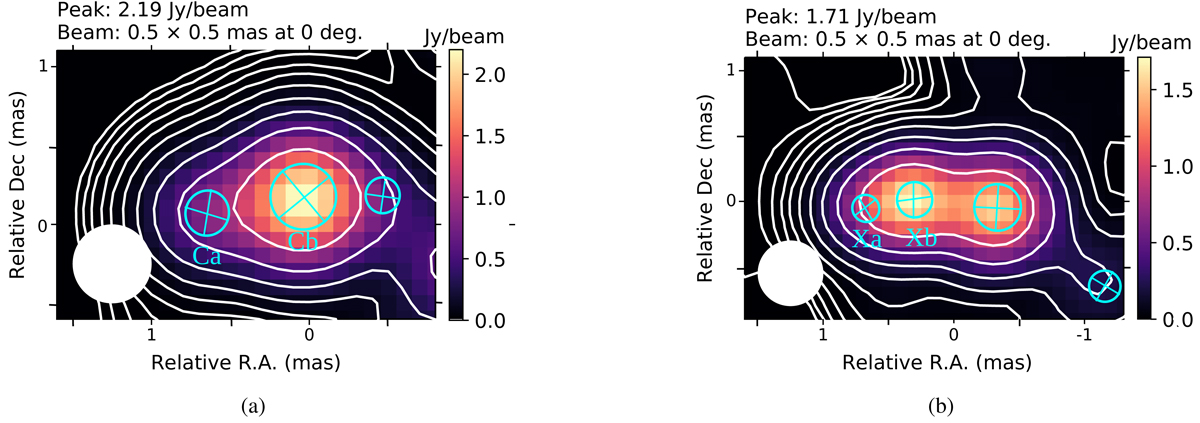
Fig. 2.
Download original image
Super-resolved CLEAN images of 3C 454.3 on 2005 July 14 with contours at 0.1%, 0.2%, 0.4%, 0.8%, 1.6%, 3.2%, 6.4%, 12.8%, 25.6%, and 51.2% of the peak intensity at each image. The 2D Gaussian components in the core region are shown in cyan. (a) At the C band (5 GHz), the features are labelled ‘Ca’ for the upstream feature and ‘Cb’ for the downstream feature or bright component. (b) Similarly, at X band (8.4 GHz), the components are labelled ‘Xa’ and ‘Xb’.
Current usage metrics show cumulative count of Article Views (full-text article views including HTML views, PDF and ePub downloads, according to the available data) and Abstracts Views on Vision4Press platform.
Data correspond to usage on the plateform after 2015. The current usage metrics is available 48-96 hours after online publication and is updated daily on week days.
Initial download of the metrics may take a while.