Open Access
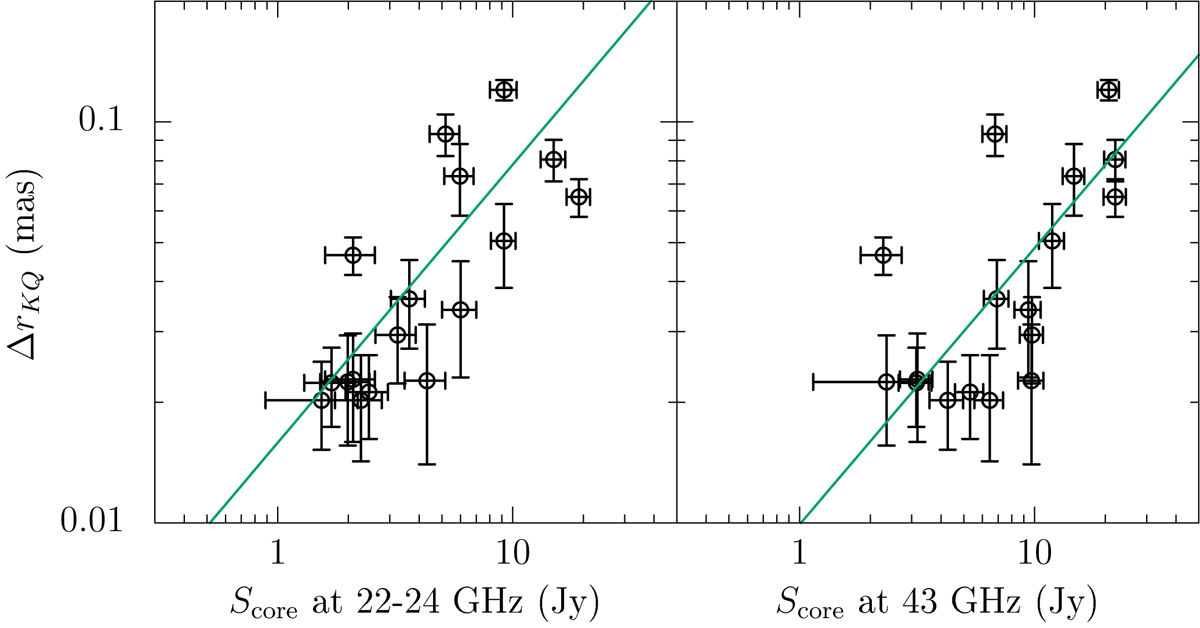
Fig. 16.
Download original image
KQ core shifts vs. core flux density at different frequencies. Positive correlations are found at 22−24 and 43 GHz. The green line indicates a power-law fit; see Table 5 for further details.
Current usage metrics show cumulative count of Article Views (full-text article views including HTML views, PDF and ePub downloads, according to the available data) and Abstracts Views on Vision4Press platform.
Data correspond to usage on the plateform after 2015. The current usage metrics is available 48-96 hours after online publication and is updated daily on week days.
Initial download of the metrics may take a while.