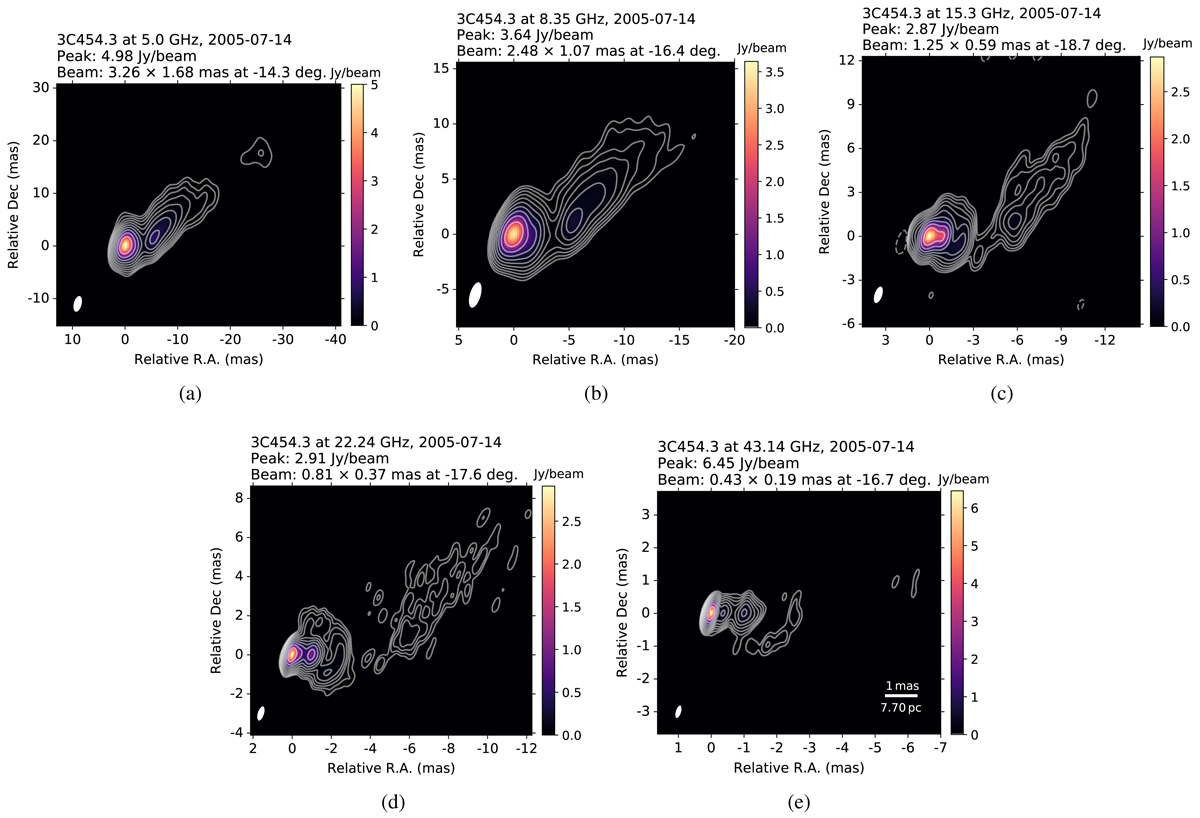
Fig. 1.
Download original image
CLEAN images of 3C 454.3 on 2005 July 14 of the following frequency bands: (a) C, (b) X, (c) U, (d) K and (e) Q with contours at −0.1%, 0.1%, 0.2%, 0.4%, 0.8%, 1.6%, 3.2%, 6.4%, 12.8%, 25.6%, and 51.2% of the peak intensity at each image. The interferometric beam (ellipse) is displayed in the bottom left corner of each image. The rms noise levels from the lowest to the highest frequency are 0.11, 0.20, 0.35, 0.30 and 0.38 mJy beam−1.
Current usage metrics show cumulative count of Article Views (full-text article views including HTML views, PDF and ePub downloads, according to the available data) and Abstracts Views on Vision4Press platform.
Data correspond to usage on the plateform after 2015. The current usage metrics is available 48-96 hours after online publication and is updated daily on week days.
Initial download of the metrics may take a while.