Open Access
Fig. 4
Download original image
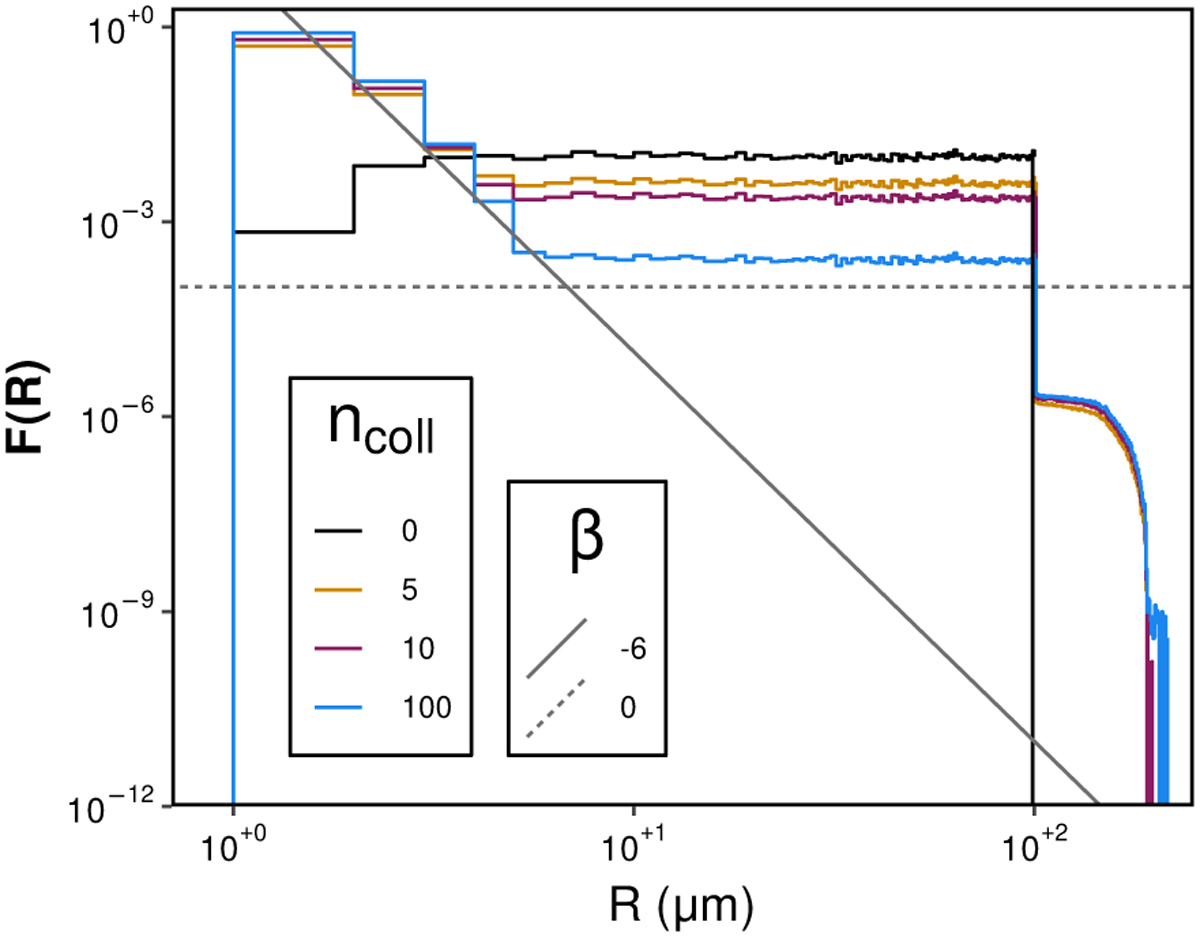
Size distribution (normalized by area). Colors denote the initial distribution and the final distribution after 5, 10, and 100 collisions. Gray lines show fits for the exponent β (see text).
Current usage metrics show cumulative count of Article Views (full-text article views including HTML views, PDF and ePub downloads, according to the available data) and Abstracts Views on Vision4Press platform.
Data correspond to usage on the plateform after 2015. The current usage metrics is available 48-96 hours after online publication and is updated daily on week days.
Initial download of the metrics may take a while.