Fig. 8
Download original image
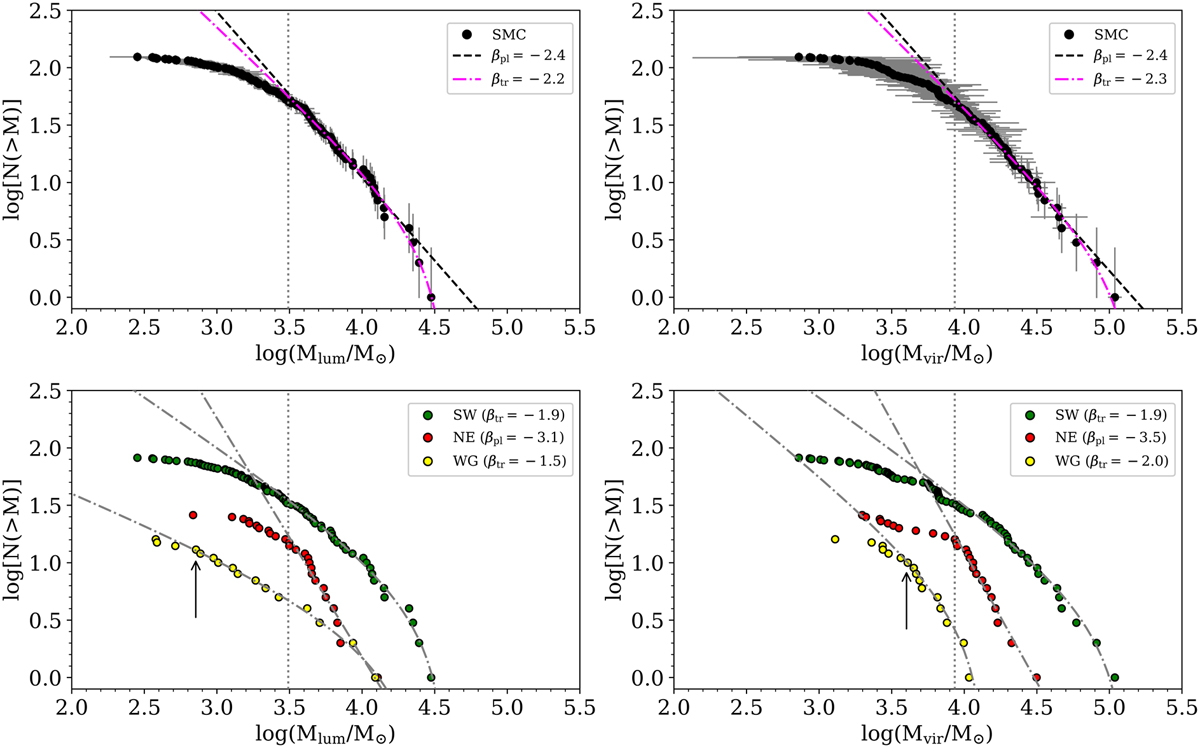
Top Panels: Cumulative luminous mass distribution (top-left) and cumulative virial mass distribution (top-right) of the SMC clouds (black dots) at 9 pc resolution. In gray bars, the error in both axes is indicated. The vertical dotted line corresponds to the completeness limits (Mlum = 3.1 × 10³ M⊙ and Mvir = 8.6 × 10³ M⊙) from which the best fit is applied to the SMC spectra. The power-law model best fit (βpl = −2.4) is shown in black dashed lines, while the truncated model (βpl ≃ −2.2) best fit is shown with magenta dot-dashed lines. Bottom Panels: The CMD of the SW, NE, and WG clouds are indicated in green, red, and yellow dots, respectively. In gray dot-dashed lines, the best fit of these CMDs is indicated. In the case of the WG clouds, the black arrows indicate the completeness limits (Mlum = 7.15 × 10²M⊙and Mvir = 4.0 × 10³M⊙).
Current usage metrics show cumulative count of Article Views (full-text article views including HTML views, PDF and ePub downloads, according to the available data) and Abstracts Views on Vision4Press platform.
Data correspond to usage on the plateform after 2015. The current usage metrics is available 48-96 hours after online publication and is updated daily on week days.
Initial download of the metrics may take a while.