Open Access
Fig. 7
Download original image
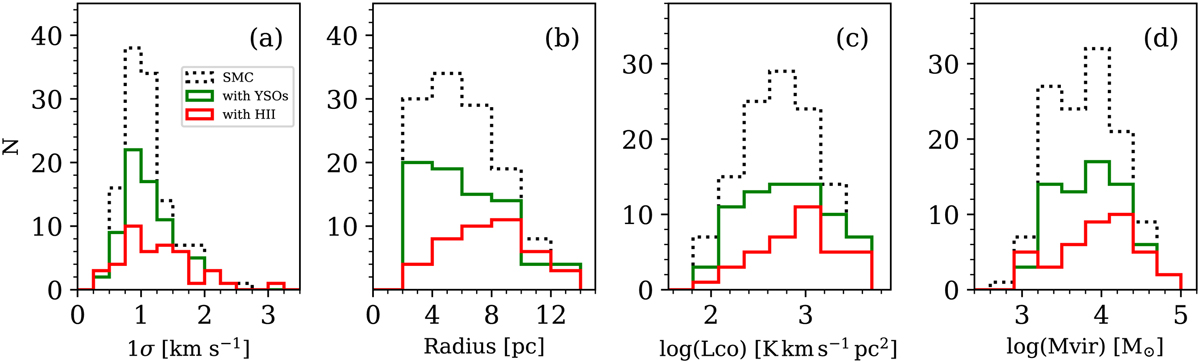
Histogram of velocity dispersion (a), radius (b), CO luminosity (c), and virial mass (d) of CO clouds of SMC spatially associated with YSOs (green) and HII regions (red). The histograms in dotted lines correspond to the full sample of the SMC (gray histograms in Fig. 4).
Current usage metrics show cumulative count of Article Views (full-text article views including HTML views, PDF and ePub downloads, according to the available data) and Abstracts Views on Vision4Press platform.
Data correspond to usage on the plateform after 2015. The current usage metrics is available 48-96 hours after online publication and is updated daily on week days.
Initial download of the metrics may take a while.