Fig. 6
Download original image
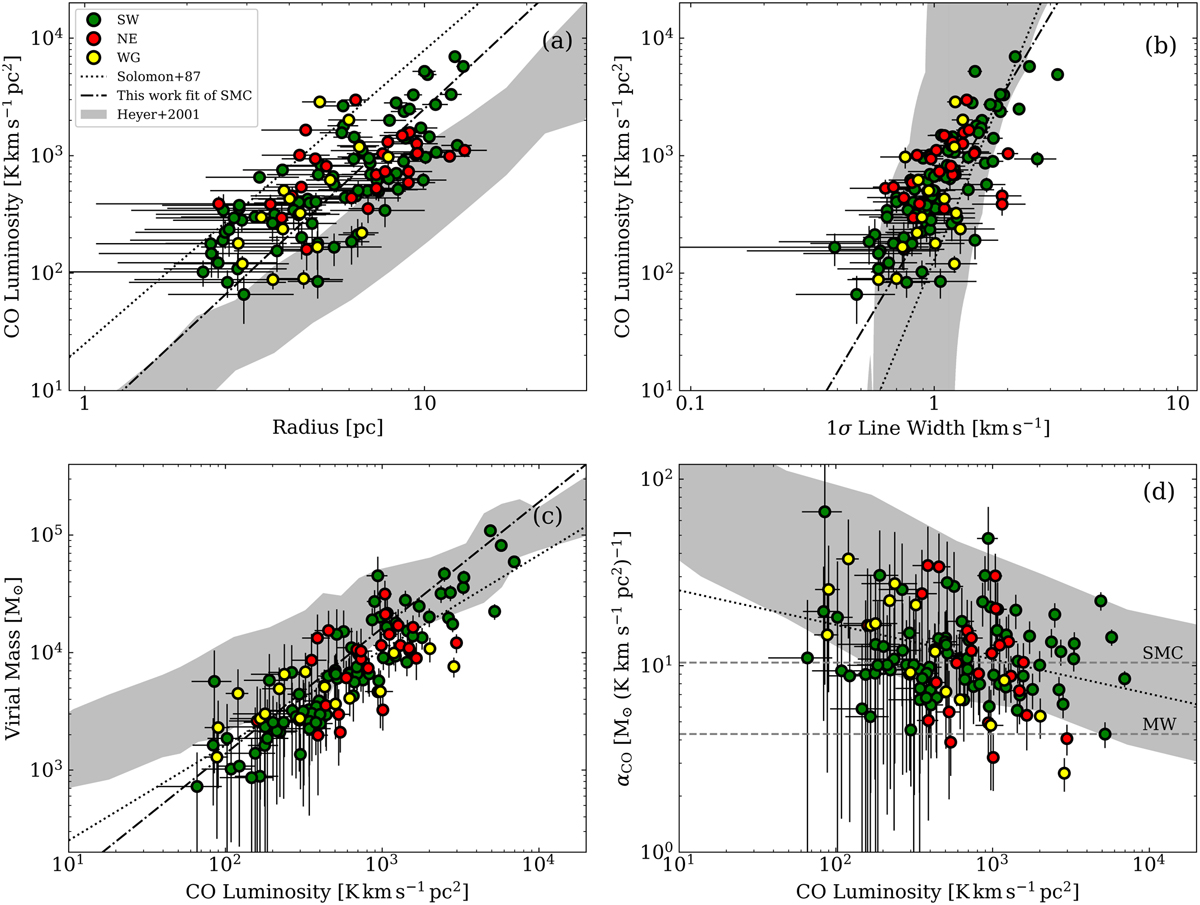
Scaling relation between luminosity, radius, velocity dispersion, virial mass, and CO-to-H2 conversion factor for SMC clouds. In all panels, the dotted lines indicate the relations of Solomon et al. (1987), while gray shadows show the location of the outer Galaxy clouds (Heyer et al. 2001). In panels (a), (b), and (c) the dot-dashed lines display the best fit for the whole sample of the SMC (S/N > 5 and R > 2.2 pc). In panel (d), the median value of αCO = 10.5 ± 5 M⊙ (K kms−1 pc2)−1 for the SMC clouds obtained in this work is shown with a horizontal dashed line. The canonical conversion factor (αCO = 4.36 M⊙ (K kms−1 pc2)−1 ) for the Milky Way (MW in the panel) defined for clouds with LCO = 105 K kms−1 pc2 is also indicated with a horizontal dashed line.
Current usage metrics show cumulative count of Article Views (full-text article views including HTML views, PDF and ePub downloads, according to the available data) and Abstracts Views on Vision4Press platform.
Data correspond to usage on the plateform after 2015. The current usage metrics is available 48-96 hours after online publication and is updated daily on week days.
Initial download of the metrics may take a while.