Fig. 5
Download original image
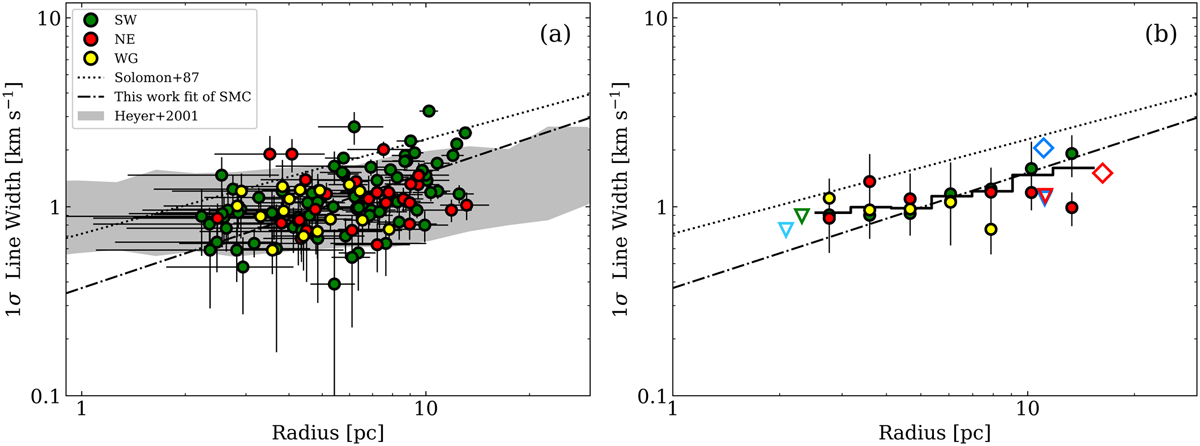
Size-linewidth relation of SMC clouds. Both parameters at 9 pc resolution were corrected for sensitivity and resolution biases by CPROPS. The SW (SW-Bar, DarkPK) clouds are indicated in green, the NE (NE-Bar, N66) clouds in red, and the WG (N83, NGC 602, N88) clouds in yellow. The black dotted line in both panels indicates the scaling relation for Milky Way GMCs (Solomon et al. 1987). In panel (a), the gray shadow corresponds to the location of the outer Galaxy clouds (Heyer et al. 2001), and the dot-dashed line shows the best fit obtained for the total sample of the well-resolved SMC clouds (S/N > 5) with a slope of 0.61 ± 0.25. In panel (b), we show the average velocity dispersion within logarithmic bins of radius (stepped line) and the best fit (dot-dashed line) of panel (a). The average συ and R for the NE (red triangle) and SW (red diamond) clouds by Muller et al. (2010) and the average values for the SW (blue diamond) and N83 (blue triangle) clouds by Bolatto et al. (2008) are shown. The green and cyan triangles correspond to median values (~1–2 pc resolution) taken from SWBarN (Saldaño et al. 2018) and NGC 602 (Fukui et al. 2020), respectively.
Current usage metrics show cumulative count of Article Views (full-text article views including HTML views, PDF and ePub downloads, according to the available data) and Abstracts Views on Vision4Press platform.
Data correspond to usage on the plateform after 2015. The current usage metrics is available 48-96 hours after online publication and is updated daily on week days.
Initial download of the metrics may take a while.