Fig. 4
Download original image
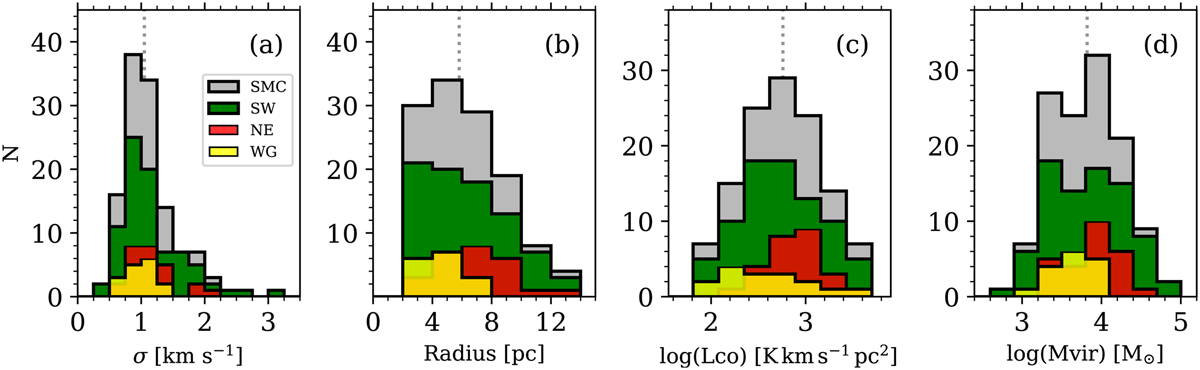
Histogram of velocity dispersion συ (a), radius (b), CO luminosity (c), and virial mass (d) for SMC clouds (gray histograms) and for clouds in the SW (green), NE (red), and WG (yellow) regions. These histograms belong to the well-resolved clouds with R ≳ 2.2pc and S/N ≳ 5. The vertical dotted line in each panel indicates the median of the parameter given in Table 3 for the total sample. These parameters were corrected for sensitivity and resolution biases from observations at 9 pc resolution.
Current usage metrics show cumulative count of Article Views (full-text article views including HTML views, PDF and ePub downloads, according to the available data) and Abstracts Views on Vision4Press platform.
Data correspond to usage on the plateform after 2015. The current usage metrics is available 48-96 hours after online publication and is updated daily on week days.
Initial download of the metrics may take a while.