Fig. 2
Download original image
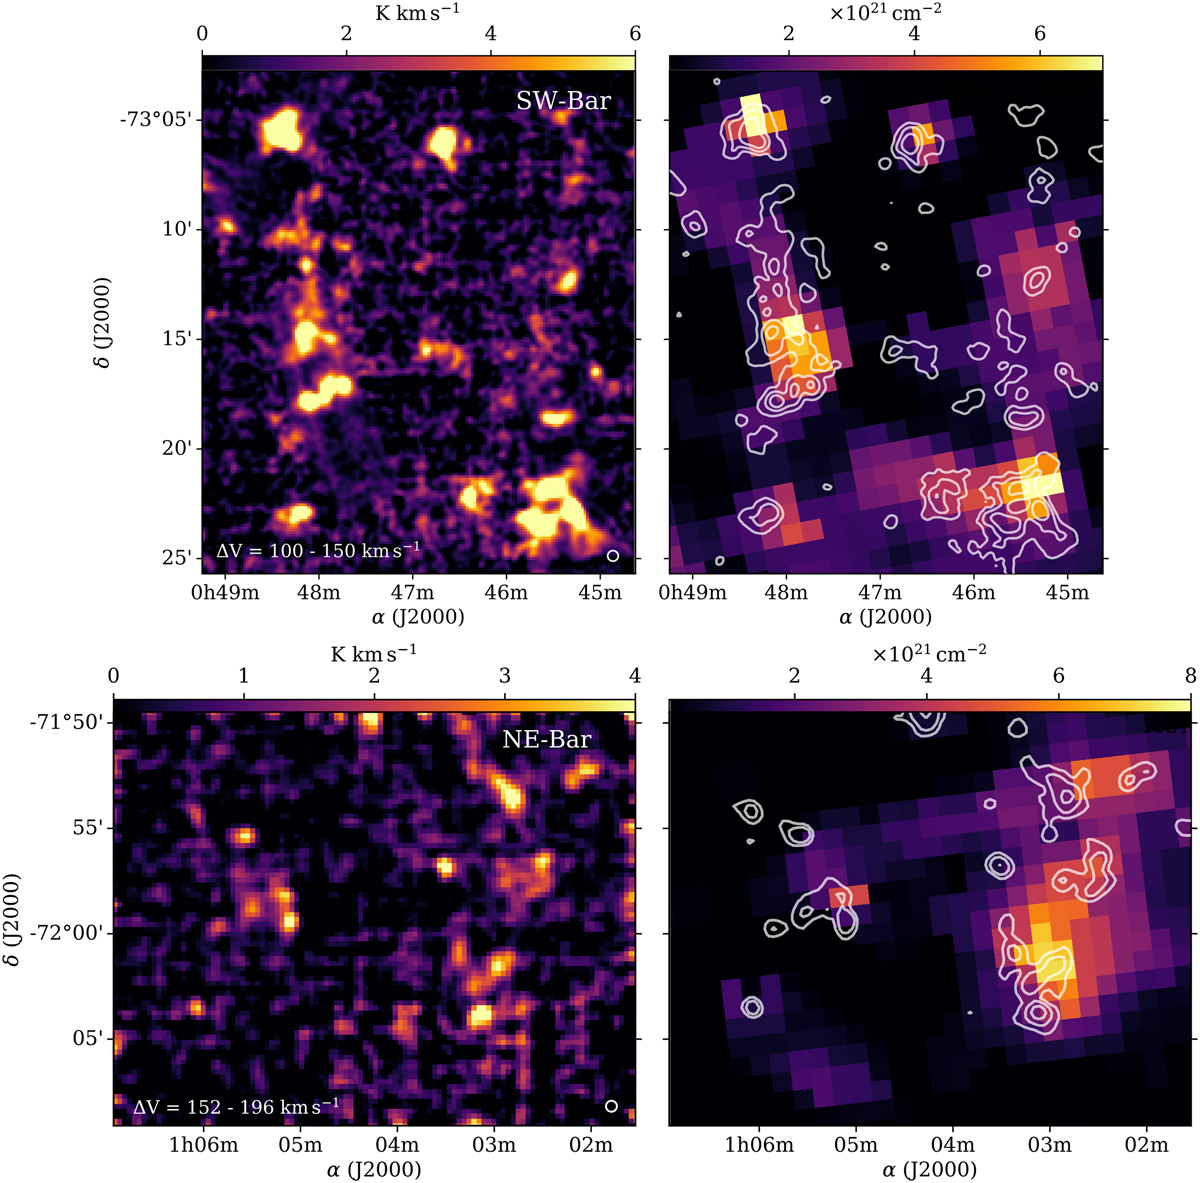
Integrated CO(2−1) emission toward SW-Bar (top) and NE-Bar (bottom) regions. Only for this figure, both CO maps were smoothed with a Gaussian kernel of a radius of 2 pixels to improve the S/N. The beam size (30″ or ~9 pc at the SMC distance) and the integration range (∆V) are indicated at the bottom of the left panels. In the right panels, the integrated CO contours (determined with the moment masked method, see Sect. 4) are overlapped to the dust-based total column density ![]() from Jameson et al. (2016). The CO contours in the SW and NE regions correspond to emissions at 1.5, 4.5, and 10.0 K kms−1 and 1.0, 2.0, and 4.5 K kms−1, respectively.
from Jameson et al. (2016). The CO contours in the SW and NE regions correspond to emissions at 1.5, 4.5, and 10.0 K kms−1 and 1.0, 2.0, and 4.5 K kms−1, respectively.
Current usage metrics show cumulative count of Article Views (full-text article views including HTML views, PDF and ePub downloads, according to the available data) and Abstracts Views on Vision4Press platform.
Data correspond to usage on the plateform after 2015. The current usage metrics is available 48-96 hours after online publication and is updated daily on week days.
Initial download of the metrics may take a while.