Fig. B.6
Download original image
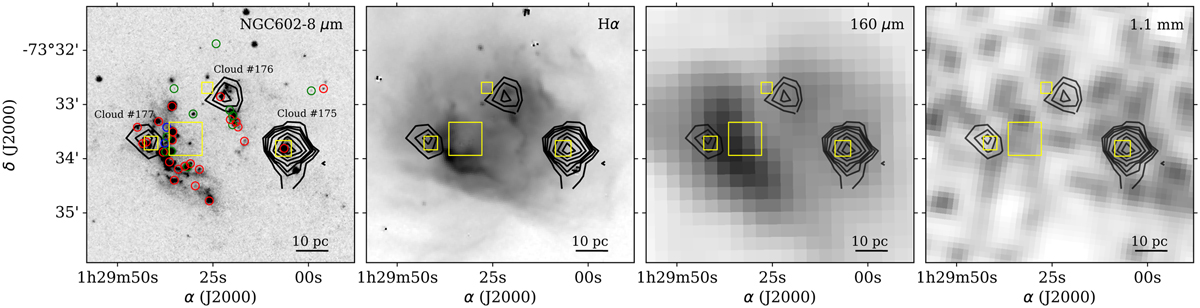
CO(2−1) emission toward NGC 602 (black contours at levels 0.4, 0.5, 0.6, 0.9, 1.3, 1.7, and 2.1 K kms−1) superimposed to the Spitzer 8 µm, MCELS Hα, Herschel 160 µm, and AzTEC 1.1 mm maps. The IDs of the three clouds correspond to Table 2. The evolutionary classification of YSOs from Carlson et al. (2011) are indicated by red (Stage I), green (Stages I-II and II), and blue (Stages II-III and III) circles. The largest yellow square represents the main stellar cluster, and the smaller squares indicate PMS subclusters (see Gouliermis et al. 2012) associated with the CO emission.
Current usage metrics show cumulative count of Article Views (full-text article views including HTML views, PDF and ePub downloads, according to the available data) and Abstracts Views on Vision4Press platform.
Data correspond to usage on the plateform after 2015. The current usage metrics is available 48-96 hours after online publication and is updated daily on week days.
Initial download of the metrics may take a while.