Fig. B.5
Download original image
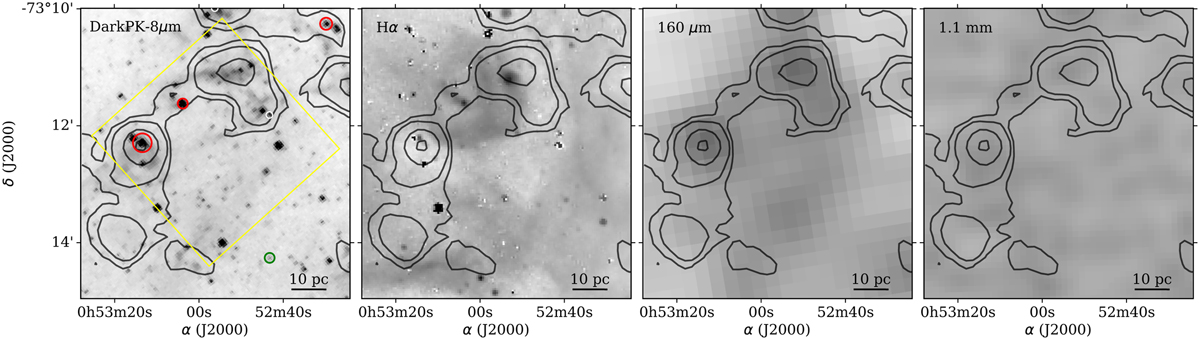
CO(2−1) emission toward DarkPK (black contours at levels 0.5, 1.0, 3.0, and 6.0 K kms−1) superimposed to the Spitzer 8 µm, MCELS Hα, Herschel 160 µm, and AzTEC 1.1 mm maps. The evolutionary classification of YSOs from Sewiło et al. (2013) is indicated by red (Stage I) and green (Stage II) circles. The sizes of these circles are proportional to the stellar luminosity. The yellow box in the 8 µm map indicates the regions where CO emission was detected with ALMA by Jameson et al. (2018).
Current usage metrics show cumulative count of Article Views (full-text article views including HTML views, PDF and ePub downloads, according to the available data) and Abstracts Views on Vision4Press platform.
Data correspond to usage on the plateform after 2015. The current usage metrics is available 48-96 hours after online publication and is updated daily on week days.
Initial download of the metrics may take a while.