Fig. B.3
Download original image
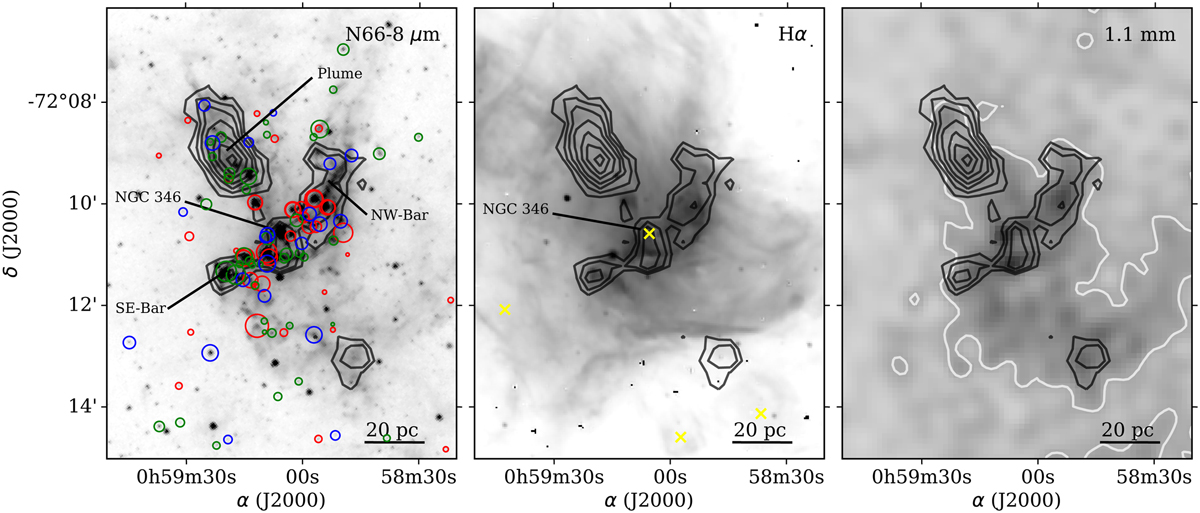
CO(2−1) emission toward N66 (black contours at levels 1.6, 2.6, 4.0, 5.7, 8.6, 11.4, and 14.3 K kms-1) superimposed to the Spitzer 8 µm (left), MCELS Hα (middle), and AzTEC 1.1 mm (right) maps. An evolutionary classification of YSOs from Sewiło et al. (2013) and Simon et al. (2007) is indicated by red (Stage I), green (Stage II), and blue (Stage III) circles. The sizes of these circles are proportional to the stellar luminosity. The main cluster of N66 (NGC 346), the plume, and the bar structures are indicated. Yellow ″×″ symbols in the middle panel indicate the HII regions from Pellegrini et al. (2012). In the right panel, the 1.1 mm emission at 5σ is highlighted.
Current usage metrics show cumulative count of Article Views (full-text article views including HTML views, PDF and ePub downloads, according to the available data) and Abstracts Views on Vision4Press platform.
Data correspond to usage on the plateform after 2015. The current usage metrics is available 48-96 hours after online publication and is updated daily on week days.
Initial download of the metrics may take a while.