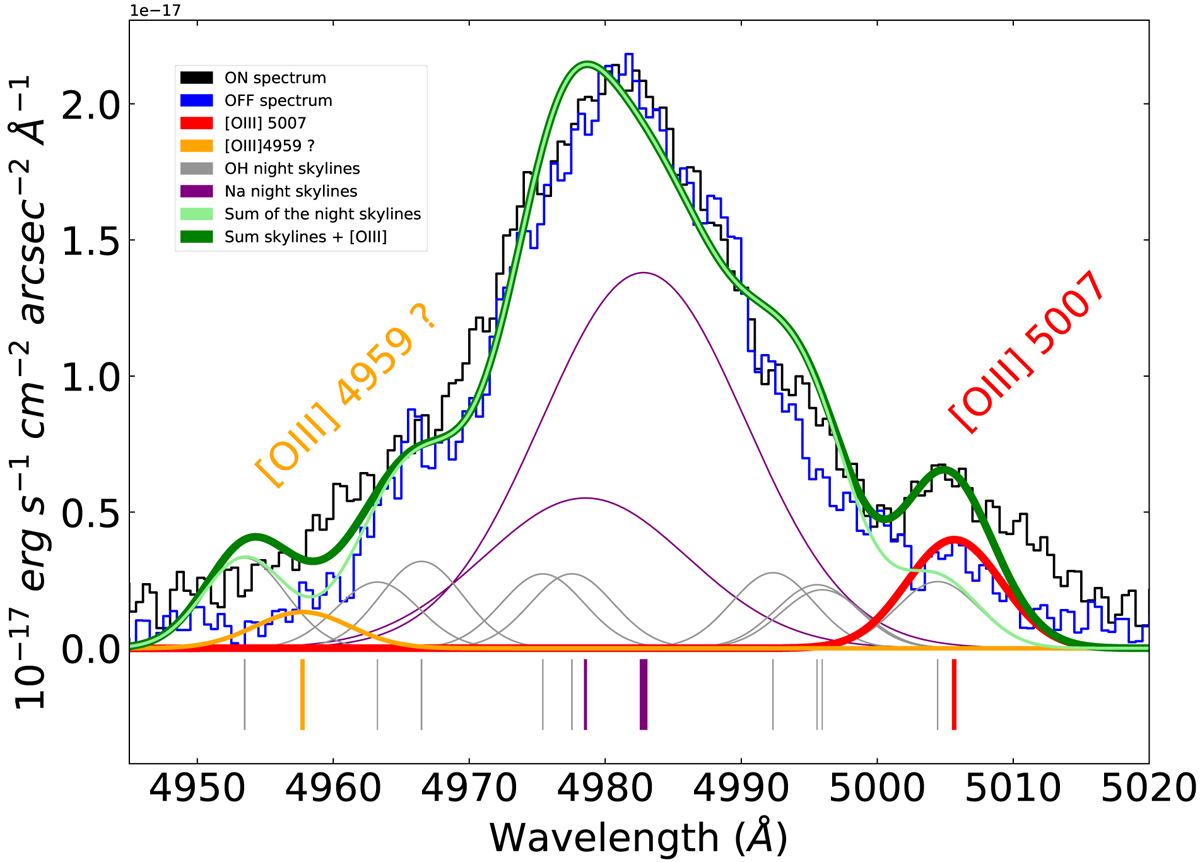
Fig. A.2.
Download original image
1D spectrum around the [OIII]4959, 5007 lines. It is heavily polluted by urban lighting using sodium lamps. Gaussian functions mimicking the UVES OH (in grey) and Na (in purple) night skylines are used to reproduce the sky emission of the offset spectrum (blue stairs). The OH Gaussian line widths are identical and fixed by the LSF at [OIII]. The complex sodium line widths are identical, but free parameters of the fit. These latter line widths are equivalent to those observed by https://astrojolo.com/wp-content/uploads/2020/01/night-sky-spectrum.png at about the same resolution power. The known wavelengths and the relative intensities of all the night sky lines are used to constrain the fit. The sum of all the night skylines is given by the light green curve. An [OIII] 5007 emission line (red line) is needed to fit the onset spectrum (black stairs), as displayed by the thick dark green curve, which is the sum of the thin light green and red curves. A Gaussian function with an amplitude of one-third of the Gaussian function of [OIII] 5007 is tentatively added to simulate the [OIII] 4959 line in order to fill the shift between the onset and offset spectra. Similarly, an Hβ line can used to fill the same type of broad shift at Hβ between the on- and offset spectra (not shown). The wavelengths of different lines are indicated by vertical lines below the spectrum, using the same colour code.
Current usage metrics show cumulative count of Article Views (full-text article views including HTML views, PDF and ePub downloads, according to the available data) and Abstracts Views on Vision4Press platform.
Data correspond to usage on the plateform after 2015. The current usage metrics is available 48-96 hours after online publication and is updated daily on week days.
Initial download of the metrics may take a while.