Fig. A.1.
Download original image
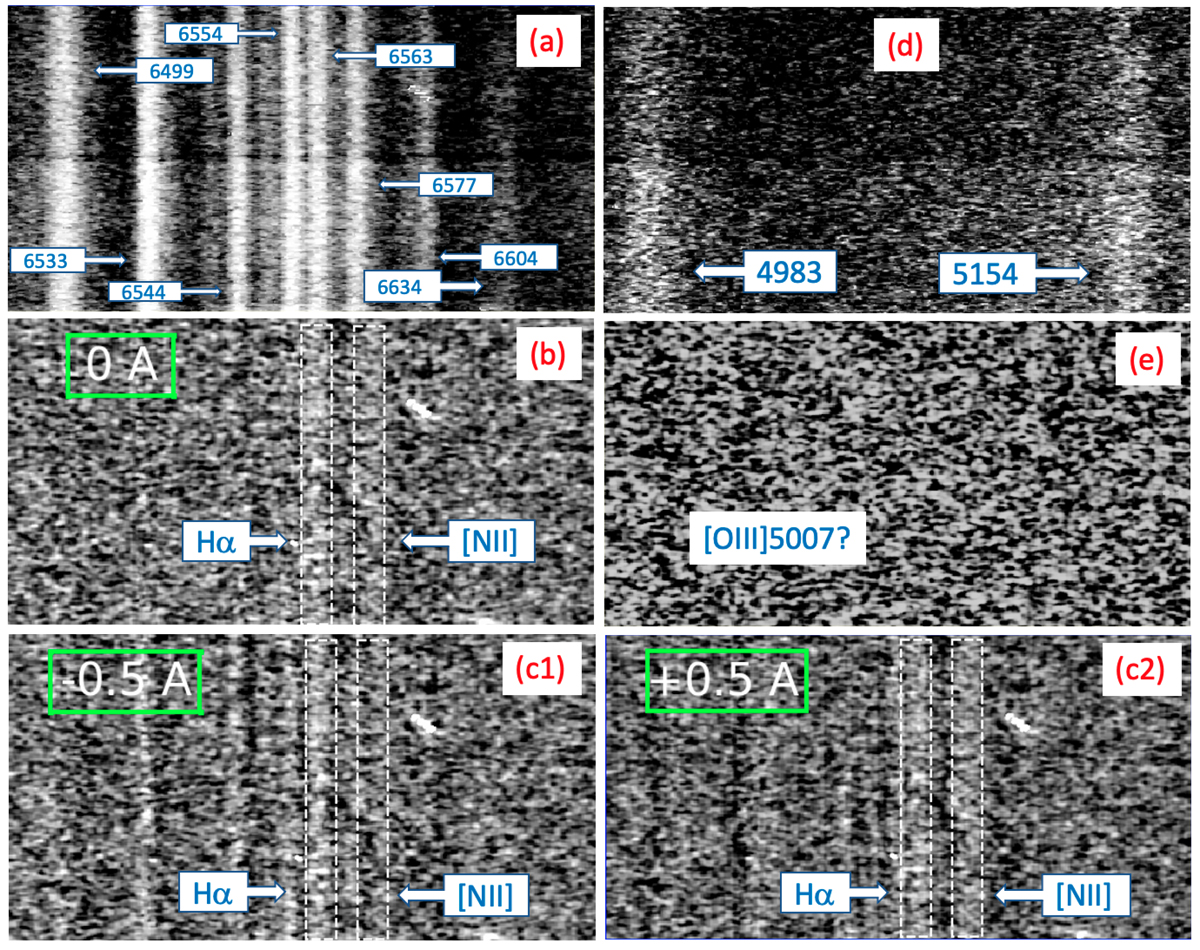
2D spectra. Panels (a), (b), and (c): Red part of the spectrum around the Hα and [NII] 6548 and 6583 lines. Panels (d) and (e): Blue part of the spectrum around [OIII] 5007. Panel (a): Raw spectrum containing the night skylines. Panel (b): Same as panel (a), but the night skylines are subtracted. Panels (c1) and (c2): Position of the sky lines is shifted by -0.5 and + 0.5 Å with respect to panel (b). The white dotted rectangle in panels (c1) and (c2) shows the position of the Hα and [NII] 6583 lines as indicated by panel (b). Panel (d): Raw spectrum showing mainly two sodium night skylines. Panel (e): Same as panel (d). The night skylines are cleanly subtracted, but the [OIII] 5007 line is not visible in the 2D spectra.
Current usage metrics show cumulative count of Article Views (full-text article views including HTML views, PDF and ePub downloads, according to the available data) and Abstracts Views on Vision4Press platform.
Data correspond to usage on the plateform after 2015. The current usage metrics is available 48-96 hours after online publication and is updated daily on week days.
Initial download of the metrics may take a while.