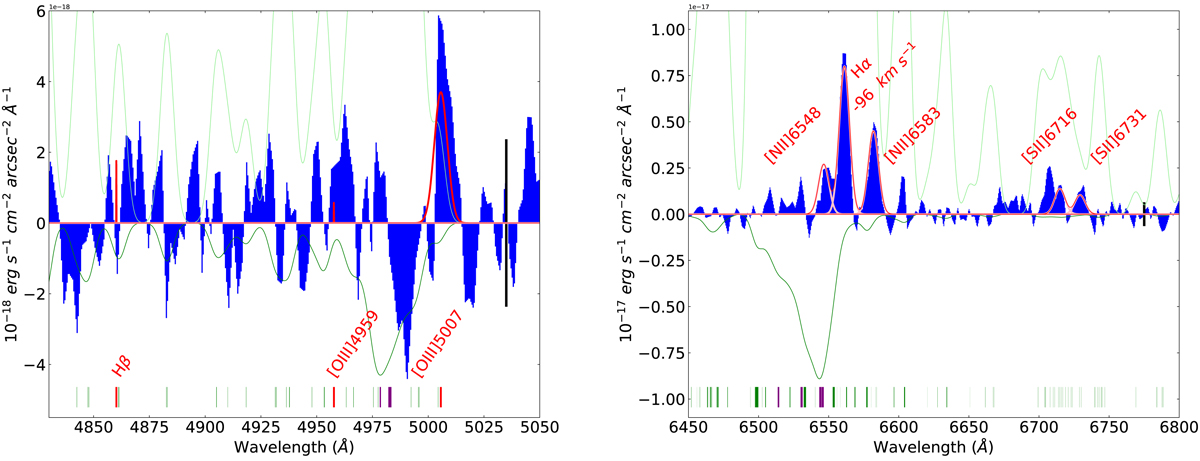
Fig. 2.
Download original image
Wavelength and flux calibrated science spectra (blue histograms) in the blue (left panel) and red (right panel) bands. The expected locations of the blueshifted Hβ, [OIII], Hα, [NII], and [SII] lines have been fitted by Gaussian function (pink lines). The red line is the sum of the Gaussian functions. The small vertical bars below the spectra indicate the night skylines from UVES (in green) and sodium emission lines due to urban light pollution of human origin (in purple), their widths illustrate their relative intensity. The sum of all those lines is over-plotted in light green. Because the night skylines extend beyond the frame, they have been downscaled by a factor 5 and 50 for the blue and the red spectrum, respectively, and are mirrored symmetrically to the x-axis to fit in the frame (in green). The bold vertical black error bar on the right side of the plots indicates the standard deviation of the continuum between the emission lines.
Current usage metrics show cumulative count of Article Views (full-text article views including HTML views, PDF and ePub downloads, according to the available data) and Abstracts Views on Vision4Press platform.
Data correspond to usage on the plateform after 2015. The current usage metrics is available 48-96 hours after online publication and is updated daily on week days.
Initial download of the metrics may take a while.