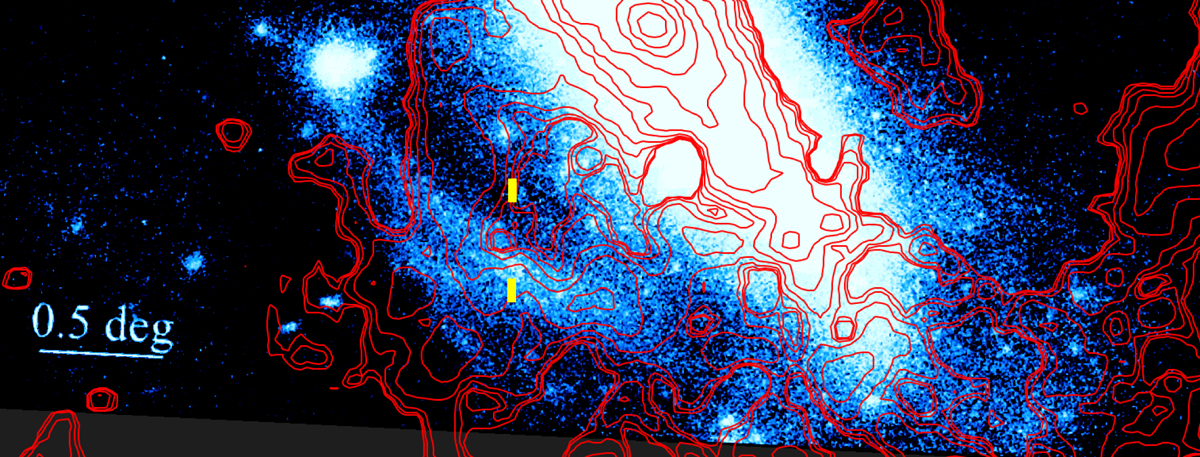
Fig. 1.
Download original image
Extended [OIII] 5007 emission region south-east of M 31 from D2023. Hα isocontours from Finkbeiner (2003, VTSS) are over-plotted in log scale (in red). These contours are described in Fig. 3. The two yellow rectangles indicate the MISTRAL long-slit positions, the one called “onset” is located to the south, and the comparison rectangle, called the “offset” slit, lies to the north, where both Hα and [OIII] emissions are fainter. Their widths are enlarged by a factor 10 for visibility. North is up and east left. The displayed FoV is ∼5.1° × 1.6°.
Current usage metrics show cumulative count of Article Views (full-text article views including HTML views, PDF and ePub downloads, according to the available data) and Abstracts Views on Vision4Press platform.
Data correspond to usage on the plateform after 2015. The current usage metrics is available 48-96 hours after online publication and is updated daily on week days.
Initial download of the metrics may take a while.