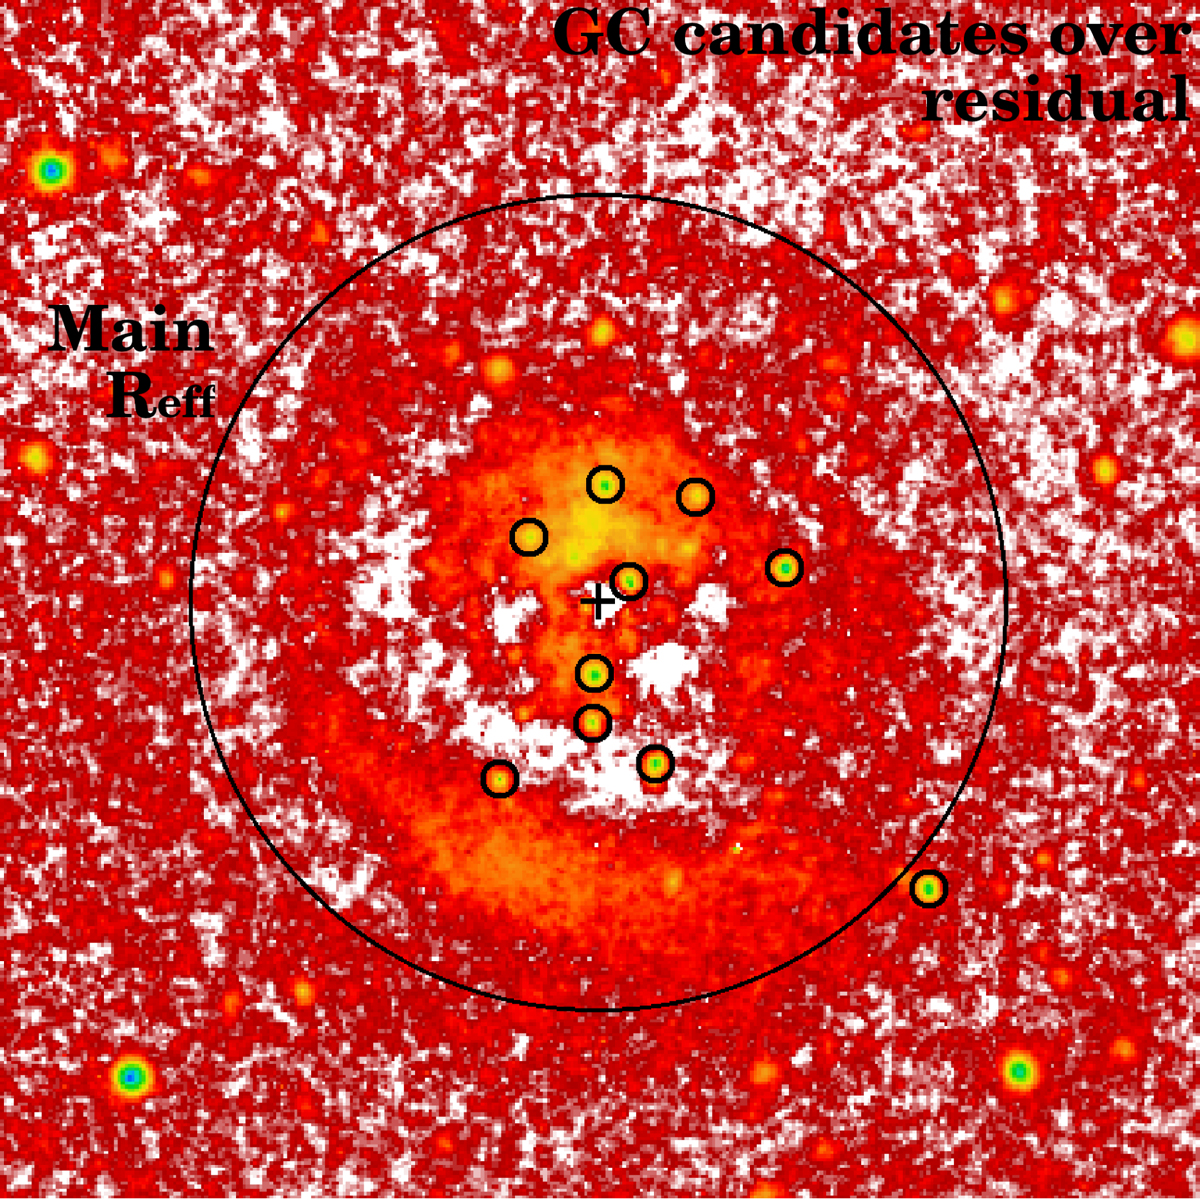
Fig. 3.
Download original image
High-contrast view of the location of the GC candidates (small black circles) on the residual g + r image after subtracting the models discussed in Sect. 3.1. We mark the centre of UGC 7346 with a black cross. The stamp is 70 arcsec sideways over the central region of UGC 7346. The image has been smoothed with the Fully Adaptive Bayesian Algorithm for Data Analysis (FABADA; Sanchez-Alarcon & Ascasibar Sequeiros 2022) software, enhancing the diffuse emission while preserving the original resolution.
Current usage metrics show cumulative count of Article Views (full-text article views including HTML views, PDF and ePub downloads, according to the available data) and Abstracts Views on Vision4Press platform.
Data correspond to usage on the plateform after 2015. The current usage metrics is available 48-96 hours after online publication and is updated daily on week days.
Initial download of the metrics may take a while.