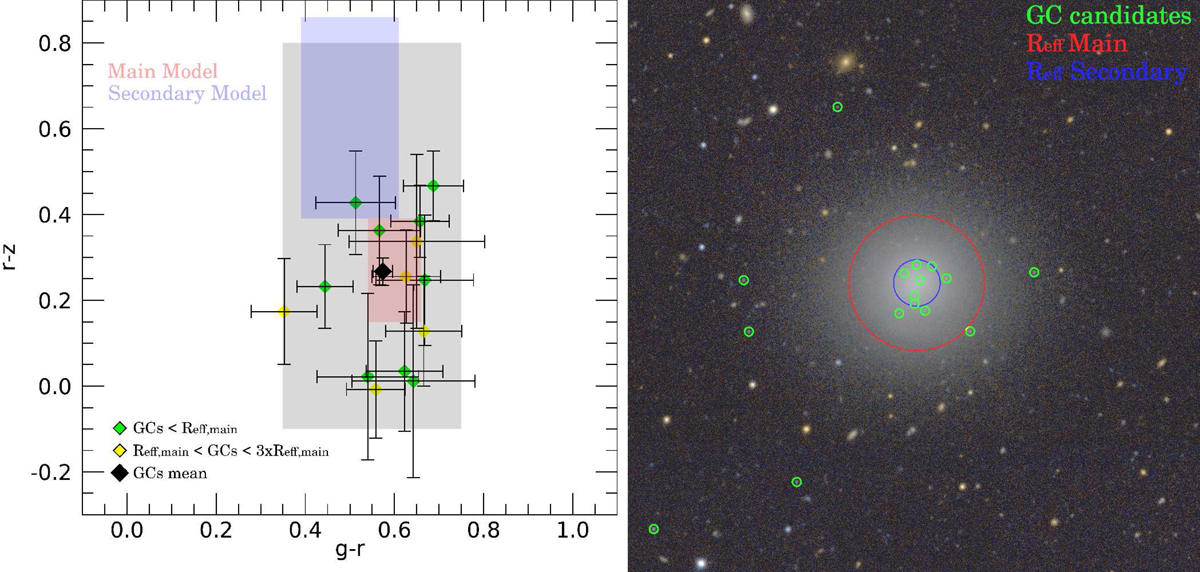
Fig. 2.
Download original image
Analysis of GC candidates around UGC 7346. Left panel: g − r vs. r − z map showing the colour of detected GC candidates and the colours of the main and secondary Models (red and blue rectangles, respectively). The gray rectangle marks the colour space explored for GC candidate detection. GCs are differentiated by green colour (within one effective radius of the main model) and yellow colour (between one and three effective radii of the main model). Right panel: composite colour image (4.5 × 4.5 arcmin) with g and r bands of UGC 7346. GC candidates detected by the selection criteria are plotted with green circles. The effective radii of the main and secondary models are indicated by the red and blue circles, respectively.
Current usage metrics show cumulative count of Article Views (full-text article views including HTML views, PDF and ePub downloads, according to the available data) and Abstracts Views on Vision4Press platform.
Data correspond to usage on the plateform after 2015. The current usage metrics is available 48-96 hours after online publication and is updated daily on week days.
Initial download of the metrics may take a while.