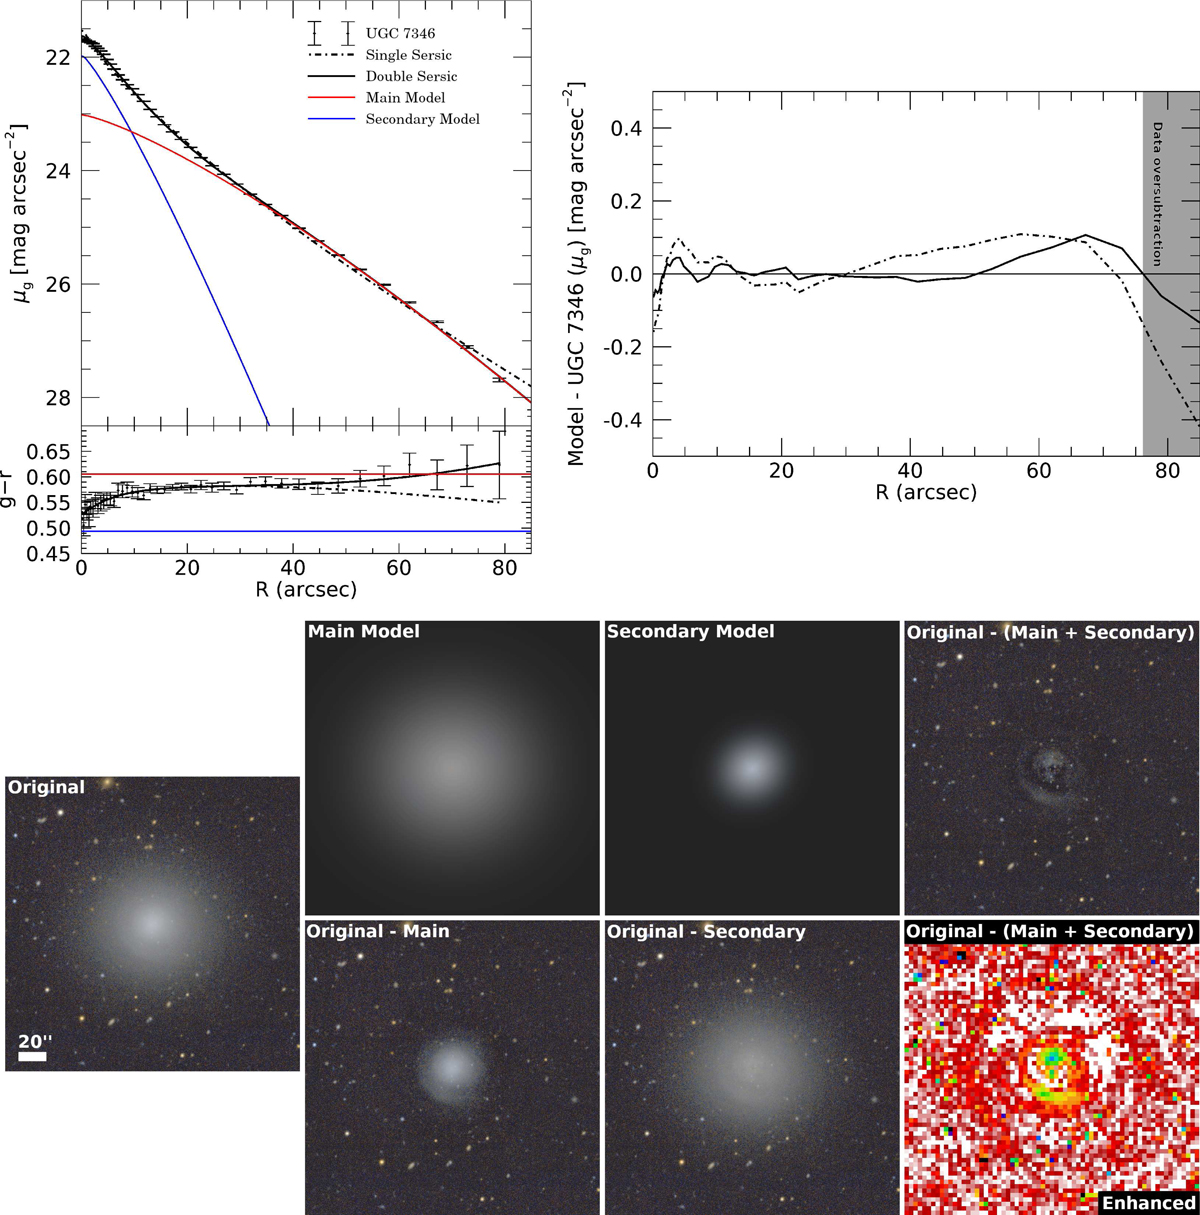
Fig. 1.
Download original image
Photometric analysis and decomposition of UGC 7346. Upper left panel: surface brightness profile in g band and g − r colour profile for UGC 7346 and models (see text). Upper right panel: residual after subtracting the surface brightness profile of UGC 7346 from the models. Bottom: modelling of UGC 7346 in two different Sersic components. The left image is the original image. The upper centre images are the two fitted Sersic models, showing the corresponding residuals of these models in the lower central images. The result of subtracting the sum of the two models is shown in the right images. The enhanced residual image is produced by binning the g + r residual image to a size of 10x10 original pixels and using a high contrast false colour, allowing a greater appreciation of the lower surface brightness structures. The rest of the colour images are constructed using g and r bands. All images have a size of 3.6 × 3.6 arcmin. North is up, east to the left.
Current usage metrics show cumulative count of Article Views (full-text article views including HTML views, PDF and ePub downloads, according to the available data) and Abstracts Views on Vision4Press platform.
Data correspond to usage on the plateform after 2015. The current usage metrics is available 48-96 hours after online publication and is updated daily on week days.
Initial download of the metrics may take a while.