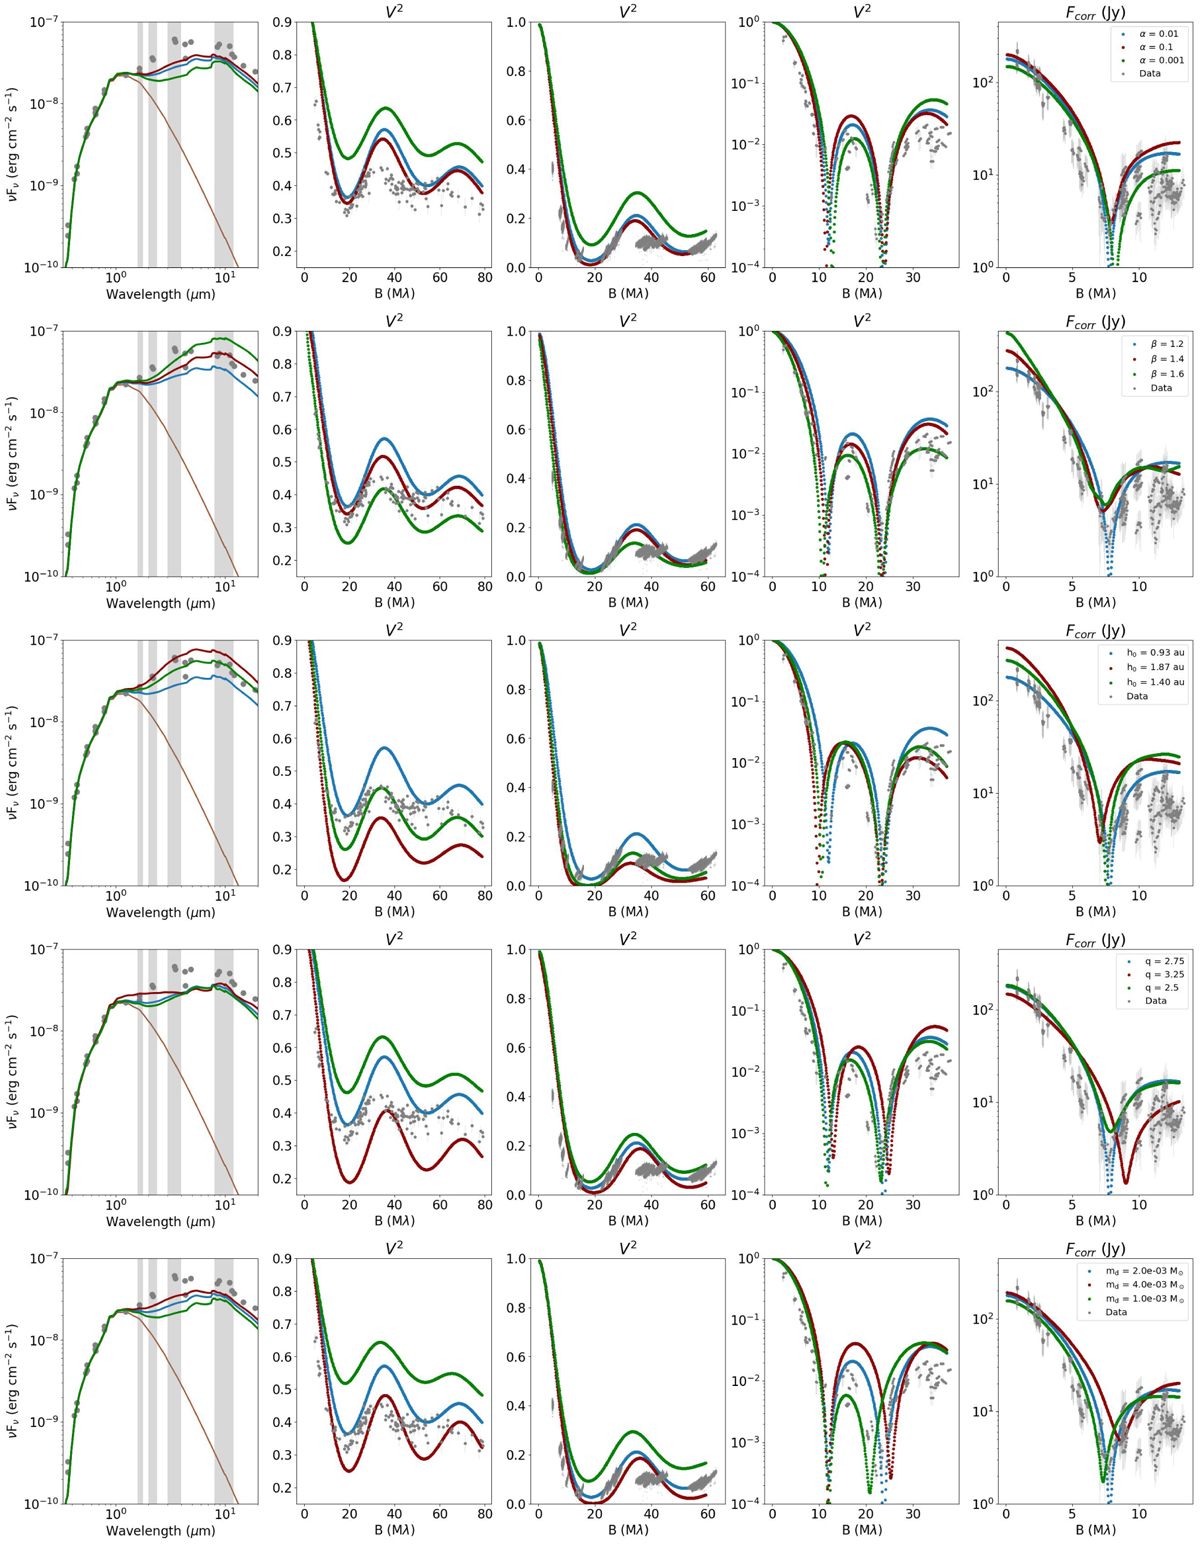
Fig. 2
Download original image
Variations in the SEDs and visibility curves for the most impactful parameters. From left to right: the reddened SEDs, H-band squared visibilities, K-band squared visibilities, L-band squared visibilities, and correlated N-band fluxes. The SED plots zoom in to the area of interest (i.e. in the wavelengths for which we have IR interferometric data) to highlight the changes. The reddened stellar photosphere is depicted in brown in the SED plots. Here, the wavelength regimes of the H, K, L, and N bands are depicted by the vertical grey areas. The reference model is always depicted in blue. The visibilities are calculated at synthetic baselines from 1 to 150 m. Interferometric data are only shown around the central wavelengths of the wavelength bands. From top to bottom: variations in α, β, h0, q, md, and rmid.
Current usage metrics show cumulative count of Article Views (full-text article views including HTML views, PDF and ePub downloads, according to the available data) and Abstracts Views on Vision4Press platform.
Data correspond to usage on the plateform after 2015. The current usage metrics is available 48-96 hours after online publication and is updated daily on week days.
Initial download of the metrics may take a while.