Fig. 8
Download original image
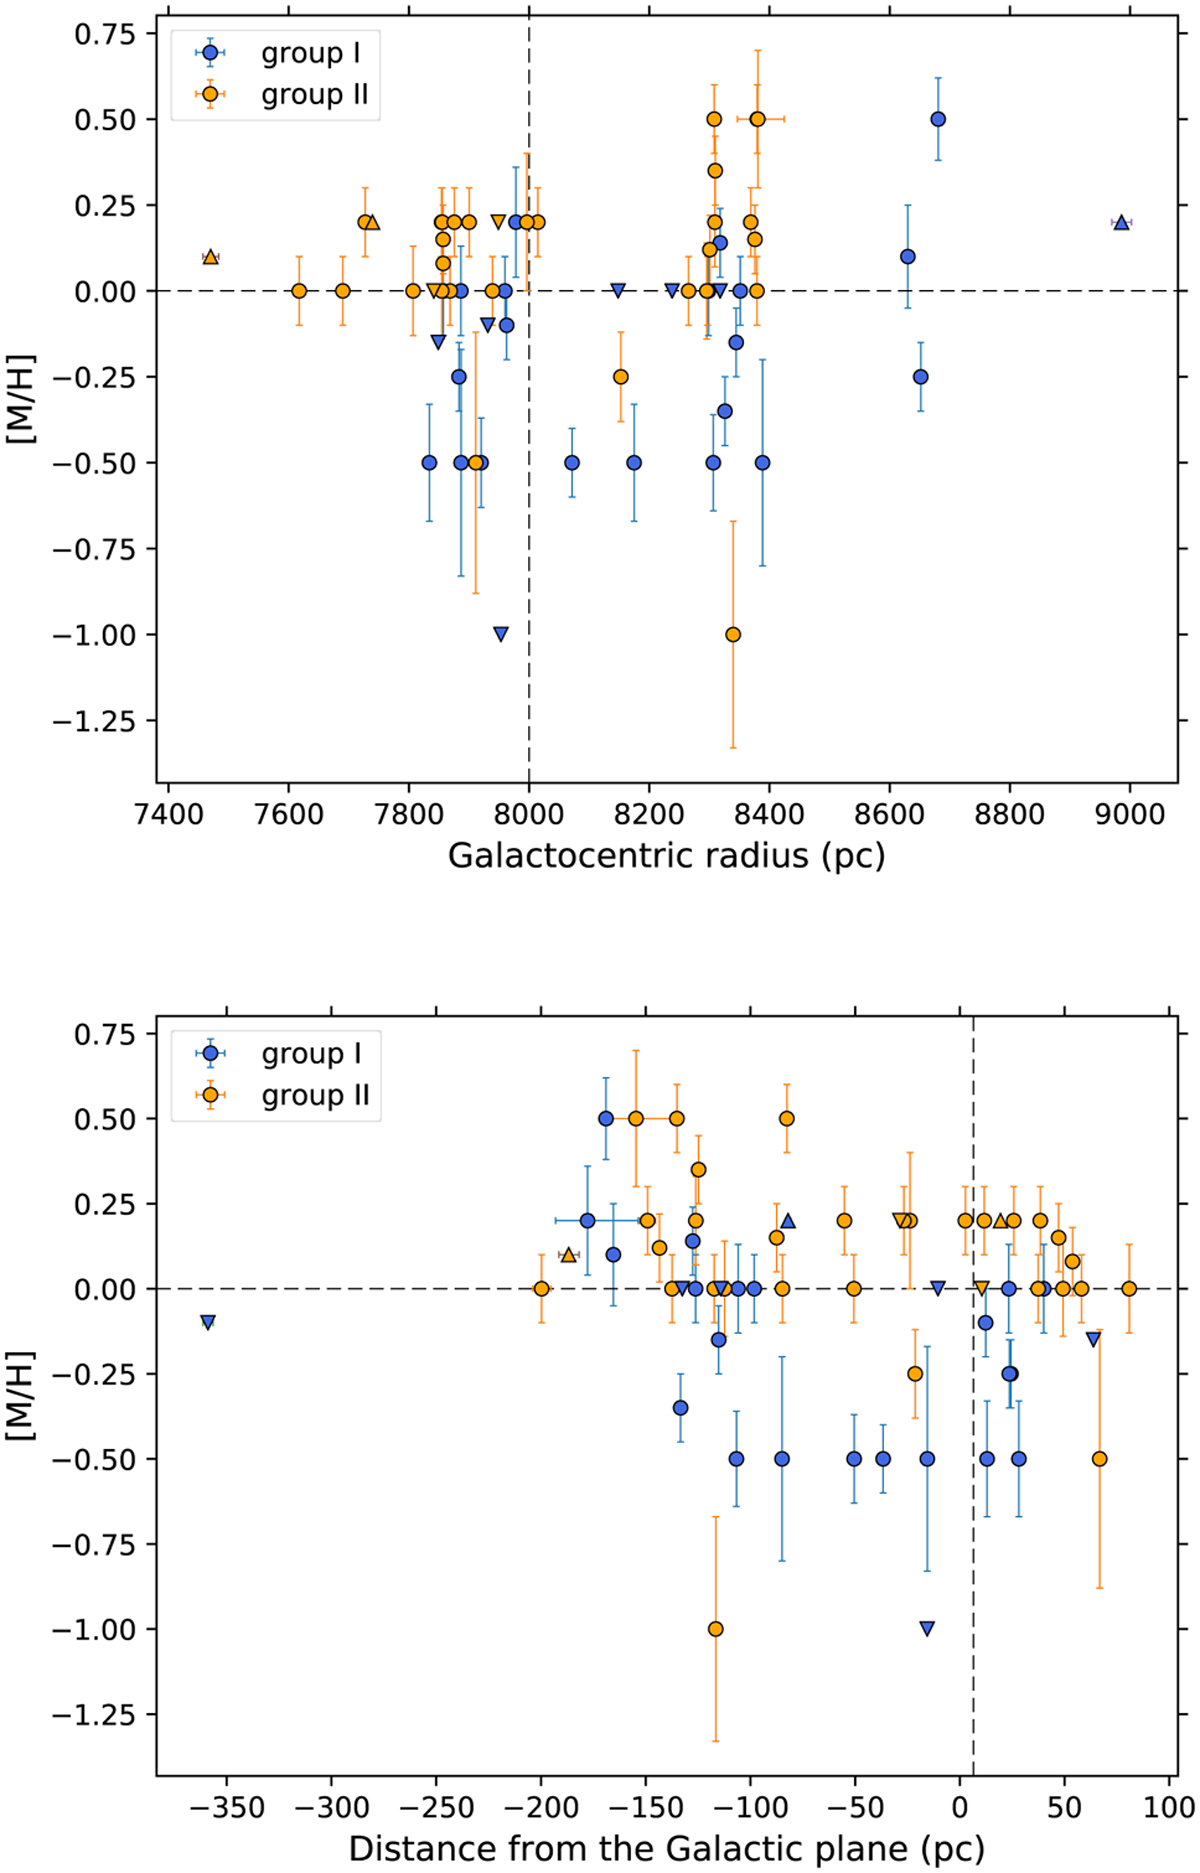
Metallicity of the stars in our sample versus the distance to the Galactic center (top) and to the galactic plane (bottom). Group I and II sources are color coded as indicated in the legends. The lower and upper limits are indicated by the up and down triangles. The values of the sun are also indicated with the vertical and horizontal dashed lines, for reference.
Current usage metrics show cumulative count of Article Views (full-text article views including HTML views, PDF and ePub downloads, according to the available data) and Abstracts Views on Vision4Press platform.
Data correspond to usage on the plateform after 2015. The current usage metrics is available 48-96 hours after online publication and is updated daily on week days.
Initial download of the metrics may take a while.