Open Access
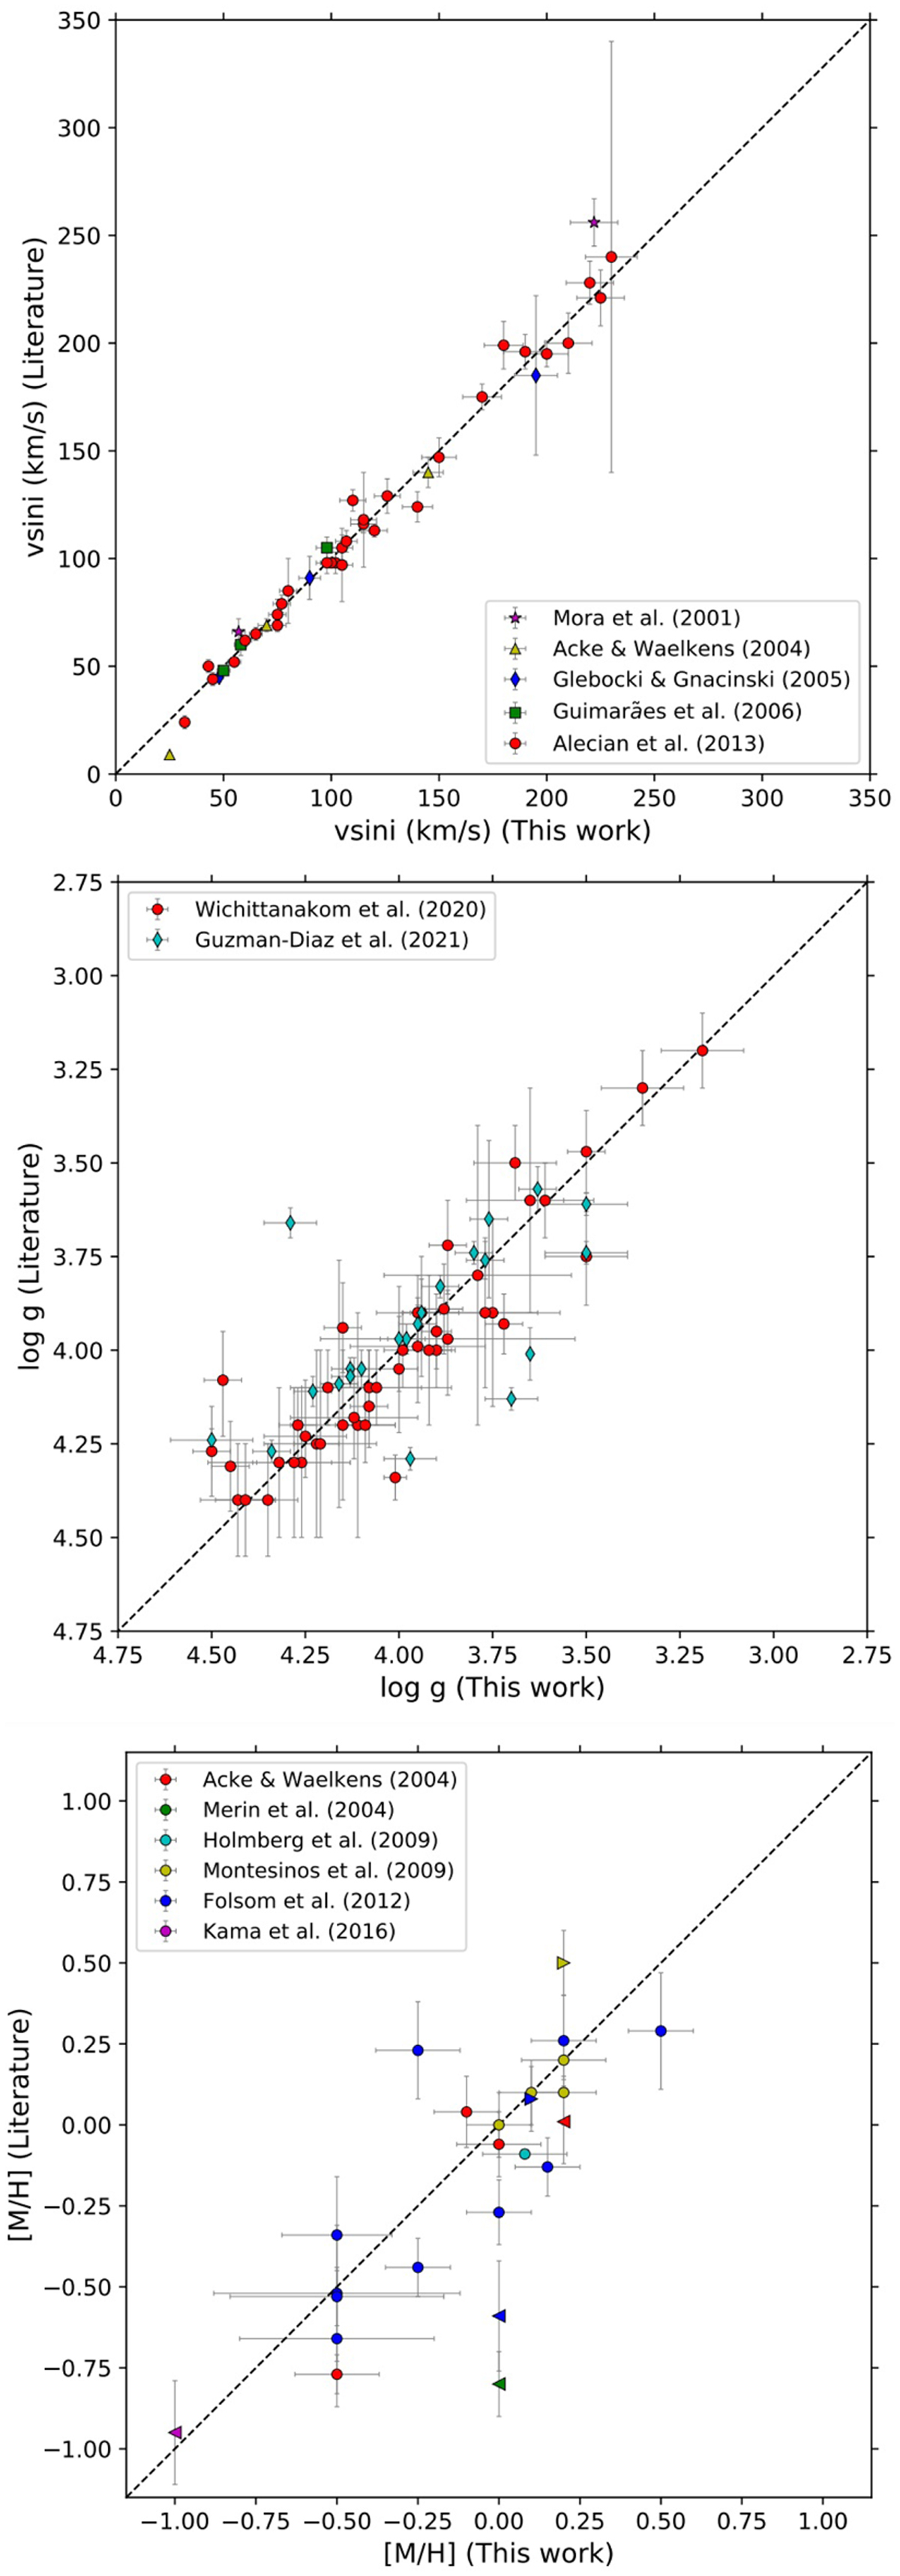
Fig. 4
Download original image
υ sin i, log ɡ and [M/H] are compared with the values found in the literature (as indicated in the legends). Error bars represent the uncertainties in these parameters, while the lower and upper limits are denoted by right- and left-pointing triangles, respectively. The black dashed line indicates equal values.
Current usage metrics show cumulative count of Article Views (full-text article views including HTML views, PDF and ePub downloads, according to the available data) and Abstracts Views on Vision4Press platform.
Data correspond to usage on the plateform after 2015. The current usage metrics is available 48-96 hours after online publication and is updated daily on week days.
Initial download of the metrics may take a while.