Fig. 3
Download original image
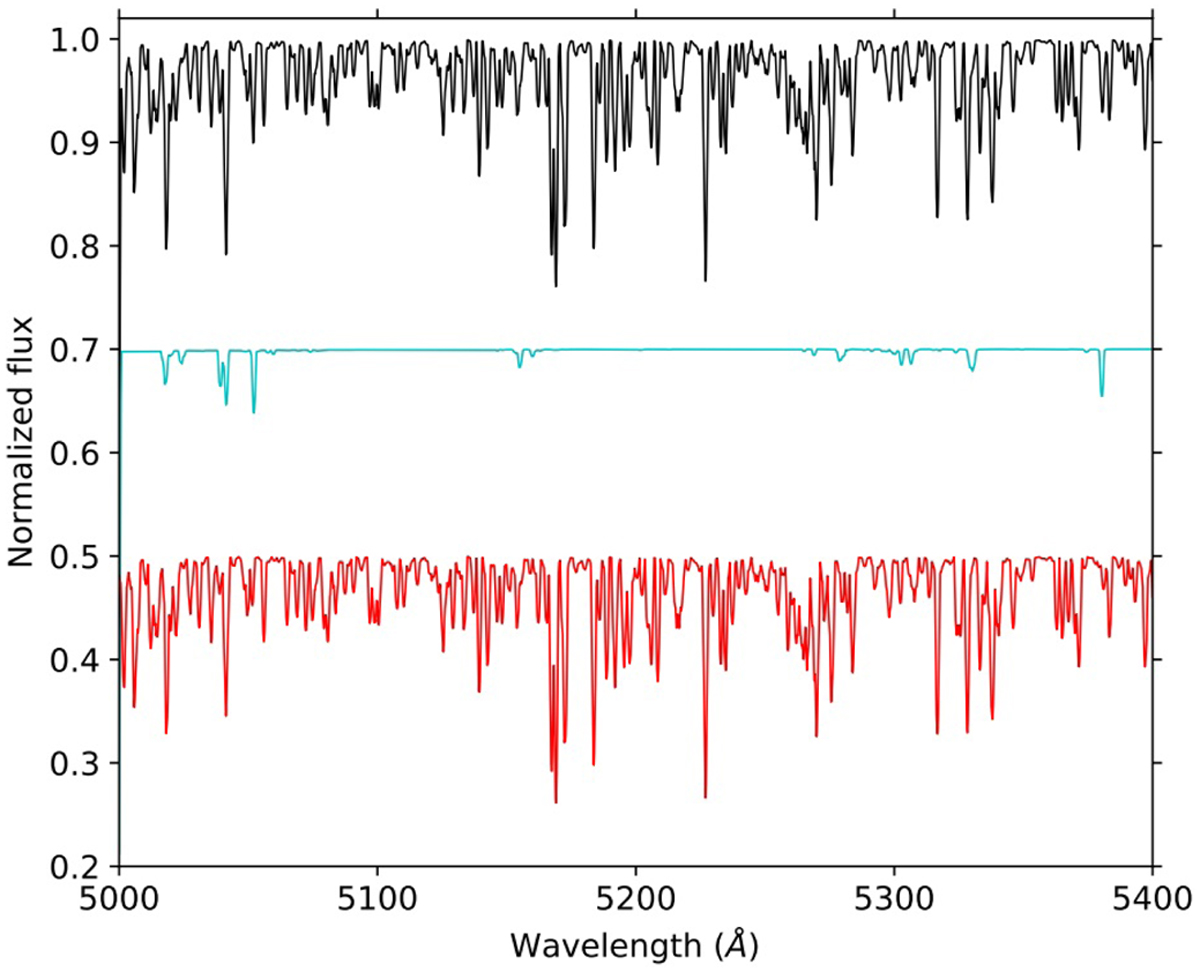
Model with Teff = 8000 K, υ sin i = 50 km s−1, and [M/H] = 0.0 in the 5000–5400 Å region is represented in black, while only the C, O, and S lines generated with the same parameters are shown in cyan. The result of subtracting the volatile elements from the first model is shown in red. The models were shifted on the y-axis for clarity.
Current usage metrics show cumulative count of Article Views (full-text article views including HTML views, PDF and ePub downloads, according to the available data) and Abstracts Views on Vision4Press platform.
Data correspond to usage on the plateform after 2015. The current usage metrics is available 48-96 hours after online publication and is updated daily on week days.
Initial download of the metrics may take a while.