Fig. 10
Download original image
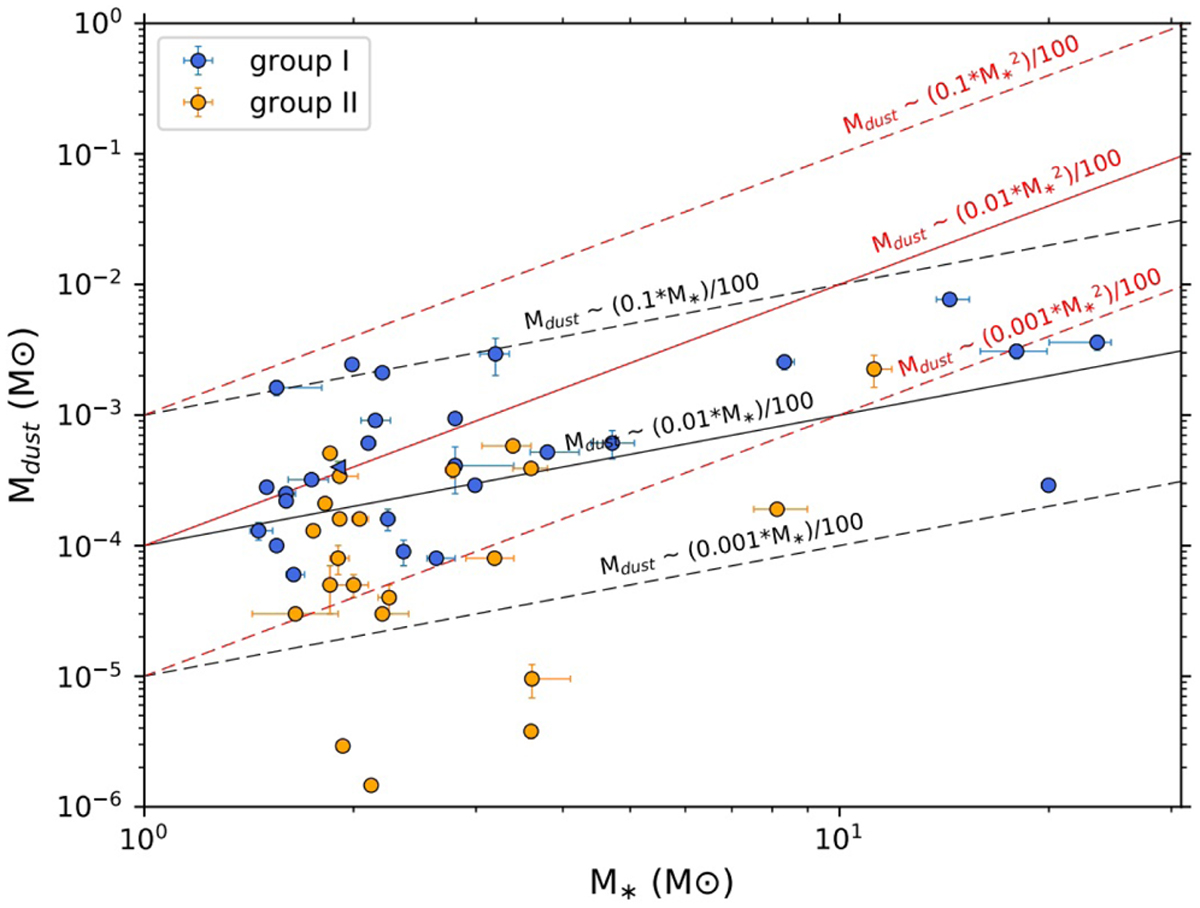
Dust disk mass versus stellar mass for most HAeBes having (sub)mm emission, as compiled in Guzmán-Díaz et al. (2021). Group I and II sources are color coded as indicated in the legend. Typical power-law trends with exponents 1 and 2 are also shown in black and red, respectively. The corresponding ±1 dex scatter are indicated with dashed lines.
Current usage metrics show cumulative count of Article Views (full-text article views including HTML views, PDF and ePub downloads, according to the available data) and Abstracts Views on Vision4Press platform.
Data correspond to usage on the plateform after 2015. The current usage metrics is available 48-96 hours after online publication and is updated daily on week days.
Initial download of the metrics may take a while.