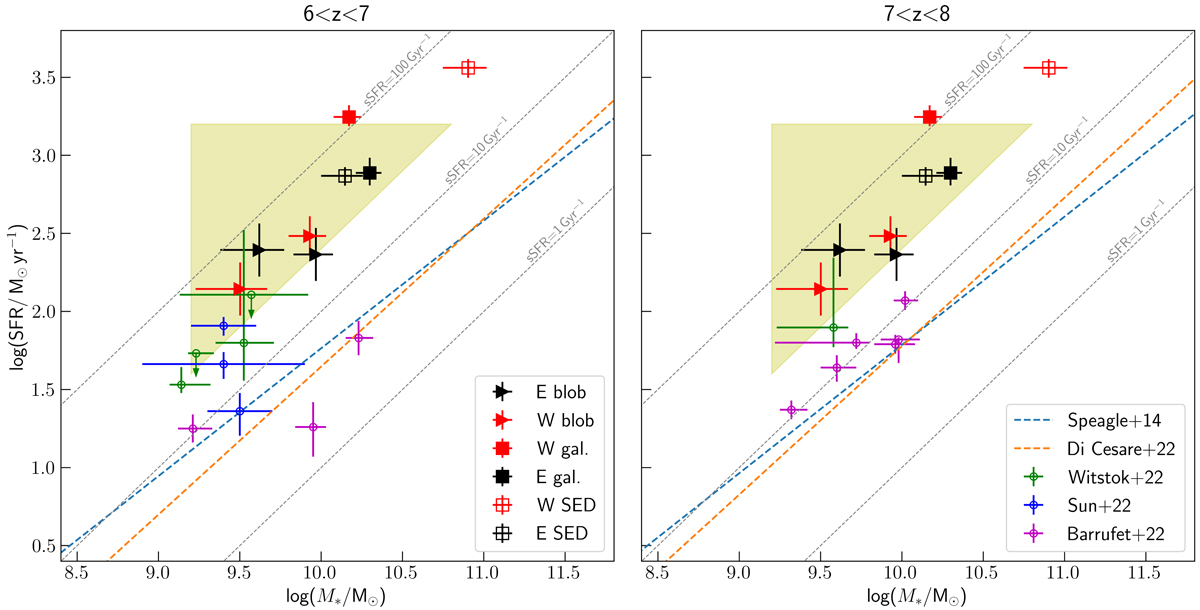
Fig. 8.
Download original image
Star formation rate vs stellar mass. This figure shows the position of the F1000W clumps associated with the [C II] clumps in the SFR versus stellar mass plane. The stellar masses are extinction-corrected and assume a continuum star formation of ∼50–100 Myr. The SFR is from the SFRCII derived by Spilker et al. (2022). The values for the E and W galaxy clumps are displayed as black and red triangles, respectively. Filled squares represent the total values for the E and W galaxies using the F1000W masses and [C II] SFRs. Empty squares are the analogous points using the M* and SFR derived from the SED fitting (see Table 3). Grey dashed lines represent constant sSFR. blue dashed and orange dashed lines in both panels represent the SFMS derived by Speagle et al. (2014) and Di Cesare et al. (2022), respectively, at z ∼ 6.5 and z ∼ 7.5. For a direct comparison, we transformed the MS by Di Cesare et al. (2022) from a Salpeter to Kroupa IMF, multiplying the SFRs and M* by 0.67 and 0.66, respectively (Madau & Dickinson 2014). Yellow-shaded area represents the ‘starburst region’ at z ∼ 4.3 defined by Caputi et al. (2017). Green, blue, and magenta stars represent the results by Witstok et al. (2022), Sun et al. (2022), and Barrufet et al. (2022), respectively.
Current usage metrics show cumulative count of Article Views (full-text article views including HTML views, PDF and ePub downloads, according to the available data) and Abstracts Views on Vision4Press platform.
Data correspond to usage on the plateform after 2015. The current usage metrics is available 48-96 hours after online publication and is updated daily on week days.
Initial download of the metrics may take a while.