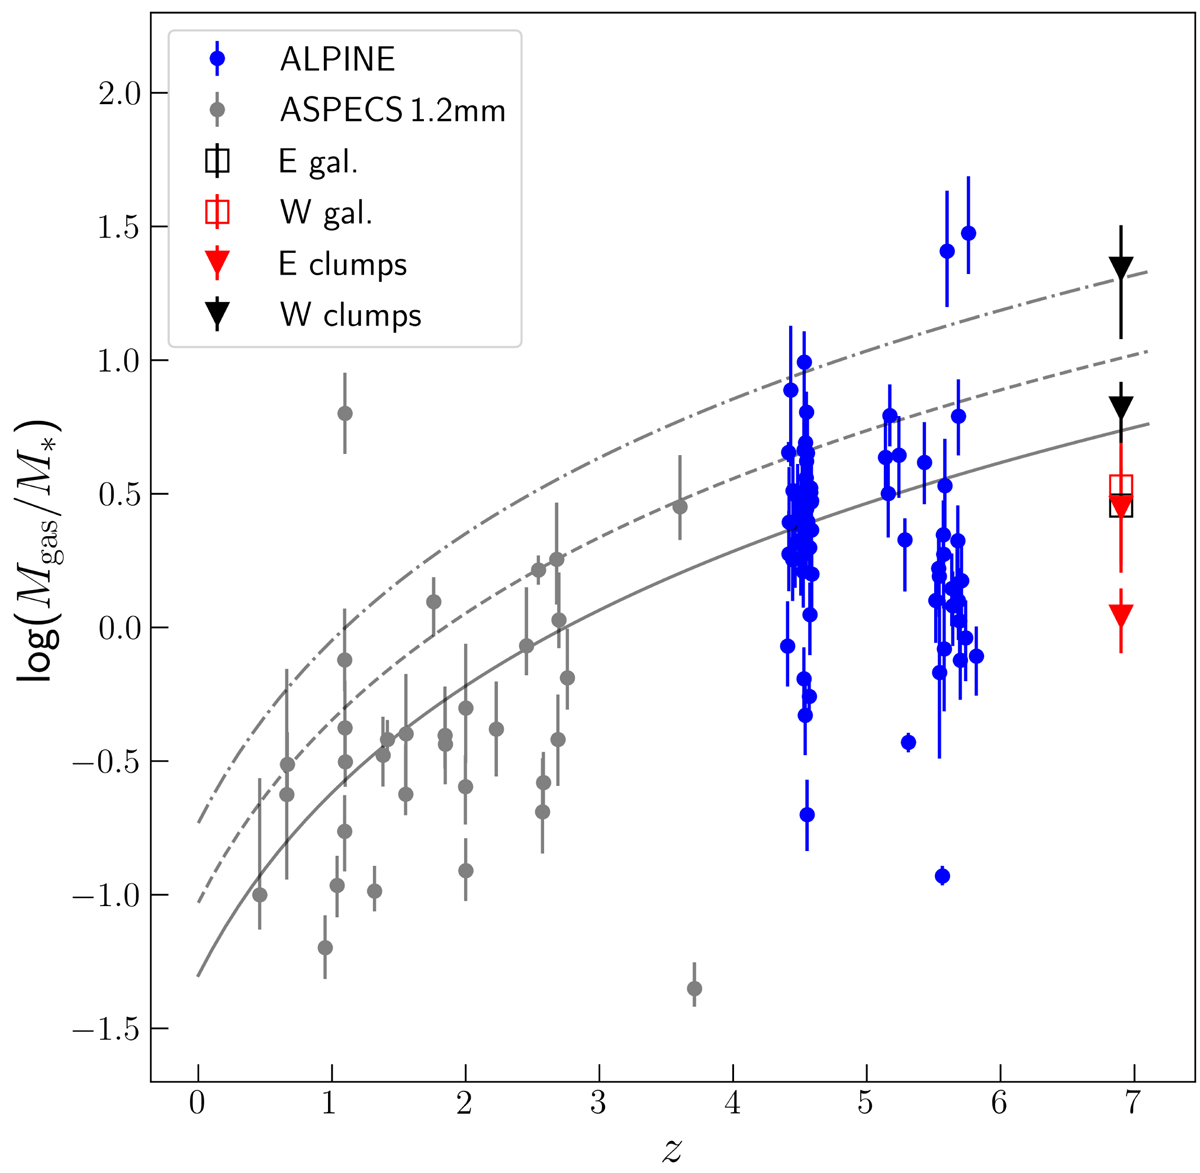
Fig. 7.
Download original image
Gas fraction vs. redshift. This figure shows the evolution of the gas mass fraction (i.e. Mgas/M*) with the redshift. Black and red triangles represent the values derived for the E and W SPT0311-058 clumps, respectively, presented in Table 5. Red and black empty squares display the Mgas/M* ratio obtained using the gas mass derived by Marrone et al. (2018) and the stellar masses computed in this work via SED fitting (see Sect. 4.1) for the E and W galaxies, respectively. For comparison, galaxies at intermediate redshifts (z ∼ 1–3) from the ASPECS 1.2 mm sample presented in Aravena et al. (2020) are included. The higher redshift range (z ∼ 4.4–6) is covered with the ALPINE sample, for which we calculate the gas mass following the LCII − Mgas relation introduced by Zanella et al. (2018). The black continuum, dashed, and dashed–dotted lines show the gas fraction evolution following Liu et al. (2019) for a galaxy with a stellar mass of M* = 5×10¹⁰ M⊙ and an SFR that is one, three, and ten times the one expected for the SFR main sequence, respectively.
Current usage metrics show cumulative count of Article Views (full-text article views including HTML views, PDF and ePub downloads, according to the available data) and Abstracts Views on Vision4Press platform.
Data correspond to usage on the plateform after 2015. The current usage metrics is available 48-96 hours after online publication and is updated daily on week days.
Initial download of the metrics may take a while.