Open Access
Fig. 6.
Download original image
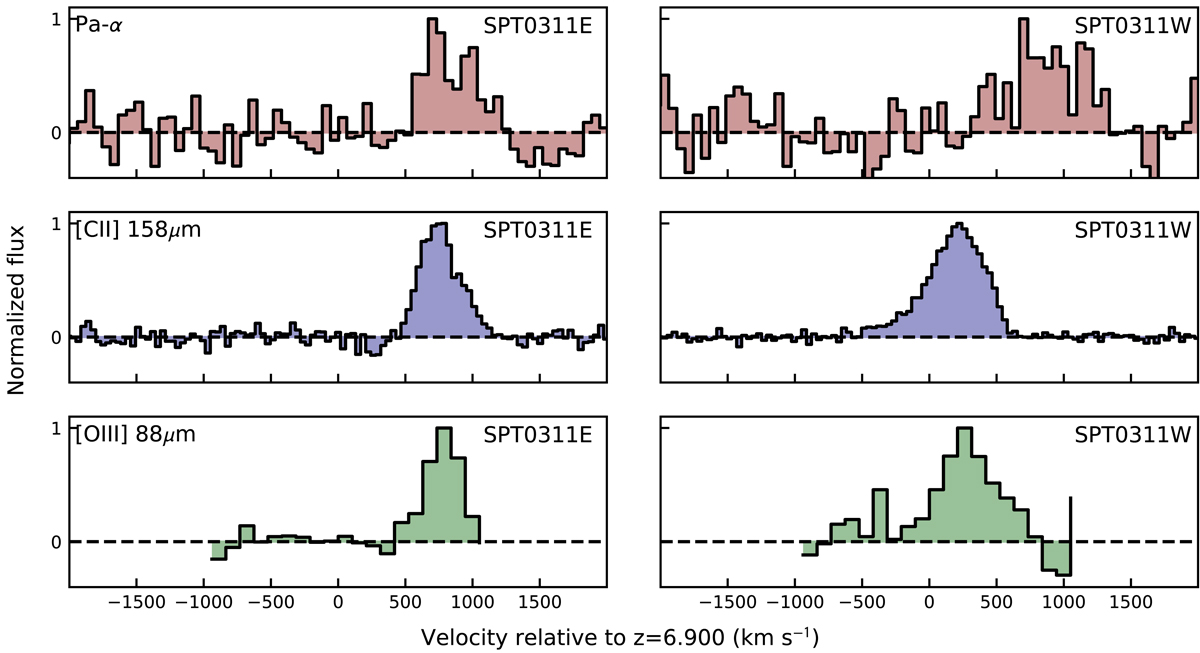
Paα line profile for the E and W components of the system together with [C II]158 μm and [O III]88 μm extracted using same apertures as for Paα line, displayed on Fig. 2. The line profiles are normalised to the peak of the lines.
Current usage metrics show cumulative count of Article Views (full-text article views including HTML views, PDF and ePub downloads, according to the available data) and Abstracts Views on Vision4Press platform.
Data correspond to usage on the plateform after 2015. The current usage metrics is available 48-96 hours after online publication and is updated daily on week days.
Initial download of the metrics may take a while.