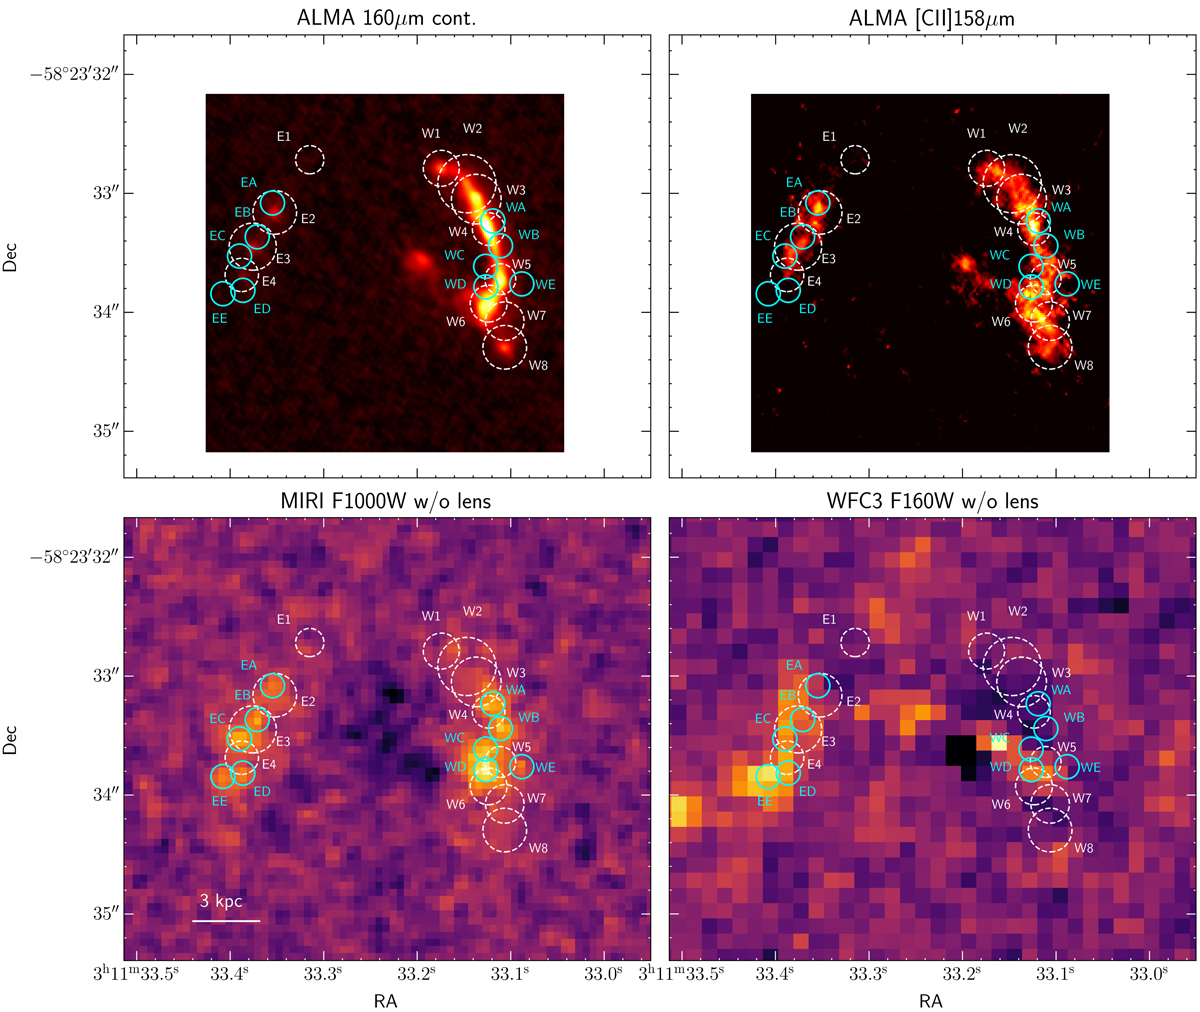
Fig. 5.
Download original image
Spatial distribution of ALMA and MIRI clumps. From left to right, ALMA rest-frame 160 μm continuum, ALMA [C II]158 μm, MIRI/F1000W, and WFC3/F160W images of SPT0311-58. The MIRI and HST images have been subtracted from the lensing galaxy (see Sect. 3.1). White dashed circles display the apertures used to extract the photometry centred on ALMA continuum clumps and defined by Spilker et al. (2022). Cyan circles mark the clumps derived in this work from the F1000W image.
Current usage metrics show cumulative count of Article Views (full-text article views including HTML views, PDF and ePub downloads, according to the available data) and Abstracts Views on Vision4Press platform.
Data correspond to usage on the plateform after 2015. The current usage metrics is available 48-96 hours after online publication and is updated daily on week days.
Initial download of the metrics may take a while.