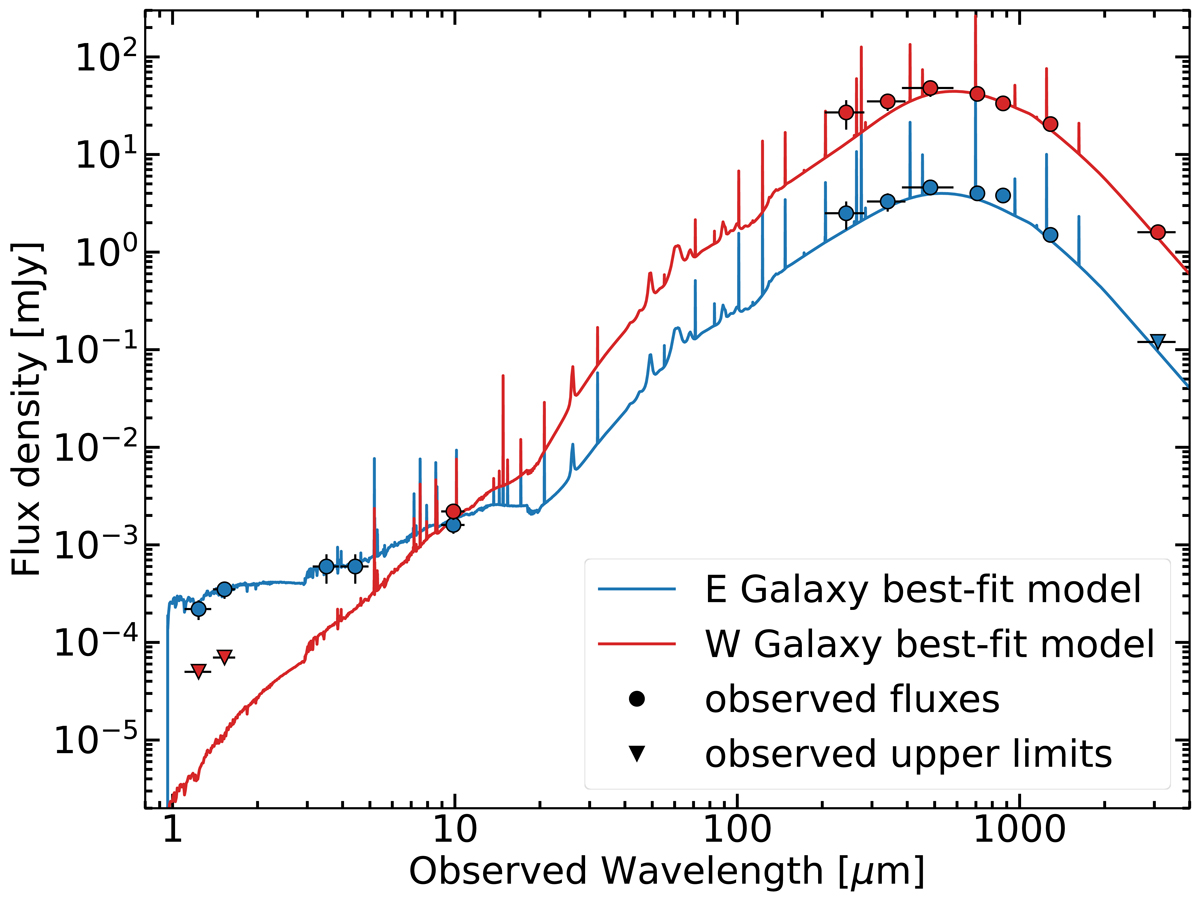
Fig. 4.
Download original image
Observed near-infrared to millimeter SEDs and best-fit models derived from CIGALE SED fitting analysis of E and W galaxies. Blue line: Best-fit model for the E galaxy. Red line: best-fit model for the W galaxy. Circles: observed fluxes for the E and W galaxies. Triangles: observed upper limits for the E and W galaxies. Observed quantities used in the fit are given in Table 2.
Current usage metrics show cumulative count of Article Views (full-text article views including HTML views, PDF and ePub downloads, according to the available data) and Abstracts Views on Vision4Press platform.
Data correspond to usage on the plateform after 2015. The current usage metrics is available 48-96 hours after online publication and is updated daily on week days.
Initial download of the metrics may take a while.