Fig. 3.
Download original image
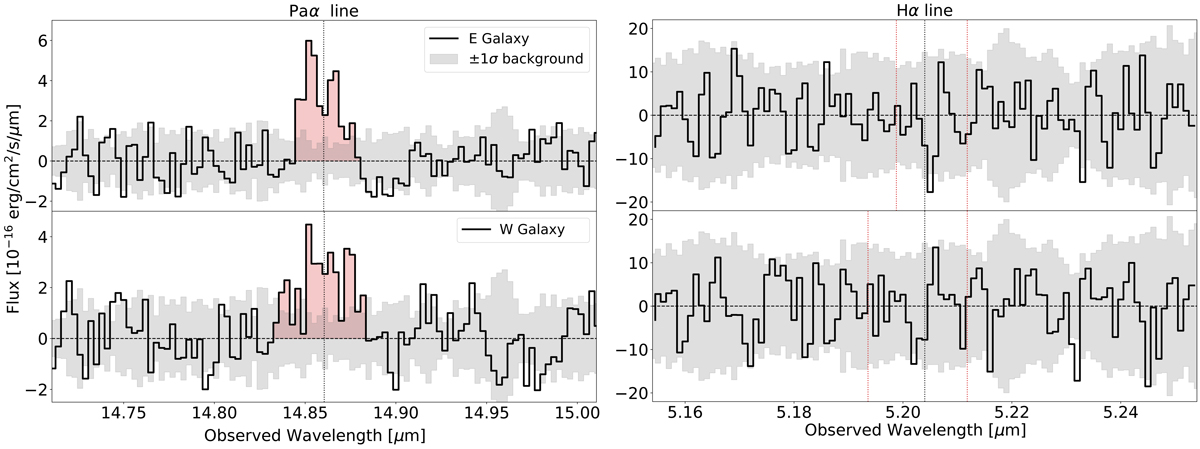
MRS spectra of Paα (left plot) and Hα (right plot) emission lines for E (upper panel) and W (bottom panel) galaxies of SPT0311-58. Black lines: MRS extracted spectra. Red filled area: wavelength integration range used to determine the Paα line flux. Red dotted lines: wavelength integration range used to determine the flux in Paα line translated to the Hα spectral range. Dotted black line: central wavelength of Paα line and expected central wavelength of Hα line determined from Paα. Gray area: the ±1σ calculated as the standard deviation form nine different background spectra.
Current usage metrics show cumulative count of Article Views (full-text article views including HTML views, PDF and ePub downloads, according to the available data) and Abstracts Views on Vision4Press platform.
Data correspond to usage on the plateform after 2015. The current usage metrics is available 48-96 hours after online publication and is updated daily on week days.
Initial download of the metrics may take a while.