Open Access
Fig. 8
Download original image
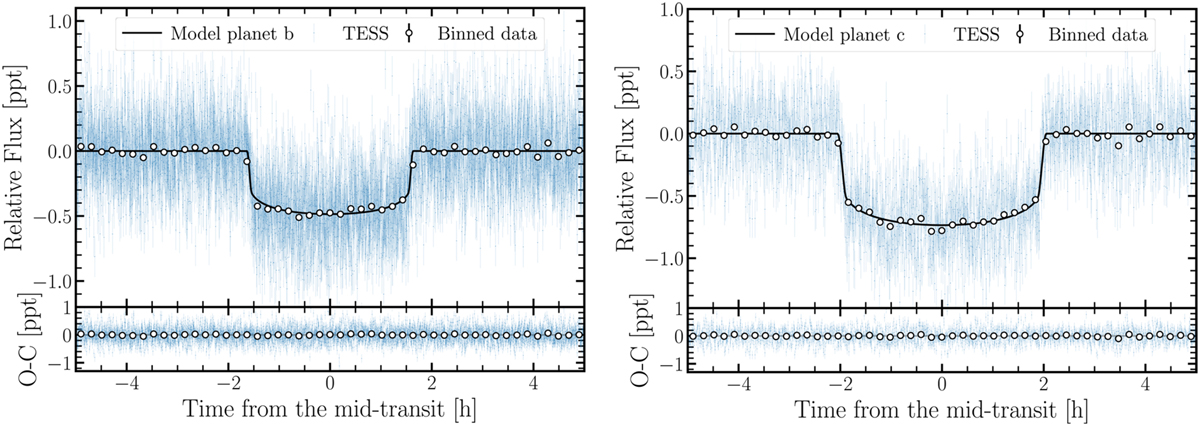
Top panels: phase-folded TESS light curves of the transits of planets b and c (blue points), binned data (white dots), and our best transit-fit model (black line). Bottom panels: residuals for the best fit.
Current usage metrics show cumulative count of Article Views (full-text article views including HTML views, PDF and ePub downloads, according to the available data) and Abstracts Views on Vision4Press platform.
Data correspond to usage on the plateform after 2015. The current usage metrics is available 48-96 hours after online publication and is updated daily on week days.
Initial download of the metrics may take a while.