Fig. 4
Download original image
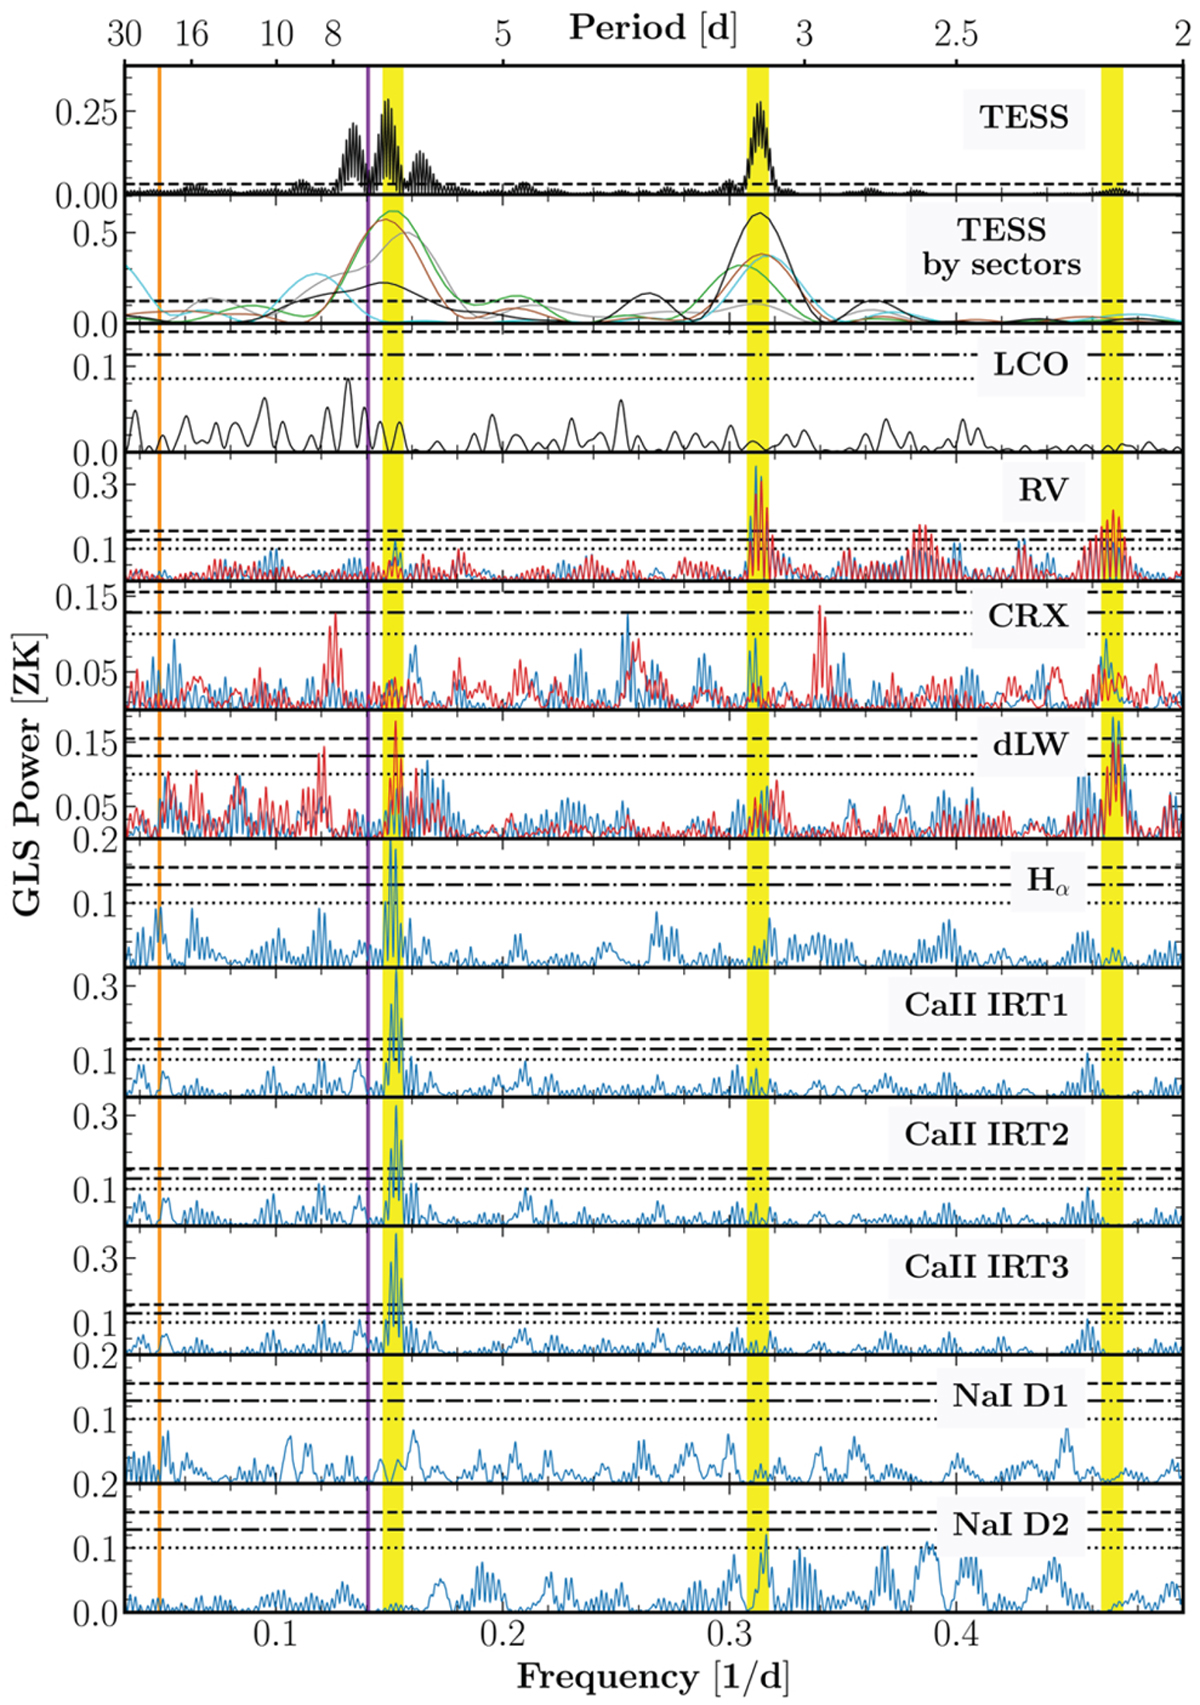
GLS periodograms for the photometric light curves, RV, and spectral activity indicators from TESS, LCO, and CARMENES VIS and NIR data. The first panel shows the periodogram of the combination of all TESS sectors. A GLS periodogram for each sector (sectors 20, 44, 45, 46, and 47 depicted in grey, green, cyan, brown, and black, respectively) is shown in second panel. The third panel shows the periodogram of the LCO dataset as a solid black line. In the remaining panels, the periodograms calculated from CARMENES VIS data are displayed in blue, and those calculated for the NIR arm are plotted in red. In all panels, the solid purple and vertical orange lines indicate the orbital periods of planets b and c, respectively. The shaded yellow bands indicate the rotation period (6.4 days), half (3.2 days), and one-third of the rotation period (2.1 days). The dashed horizontal black lines correspond to FAP levels of 10%, 1%, and 0.1% (from bottom to top). The first two panels only include the 0.1% FAP multiplied by a factor 100 for clarity.
Current usage metrics show cumulative count of Article Views (full-text article views including HTML views, PDF and ePub downloads, according to the available data) and Abstracts Views on Vision4Press platform.
Data correspond to usage on the plateform after 2015. The current usage metrics is available 48-96 hours after online publication and is updated daily on week days.
Initial download of the metrics may take a while.