Open Access
Fig. 2
Download original image
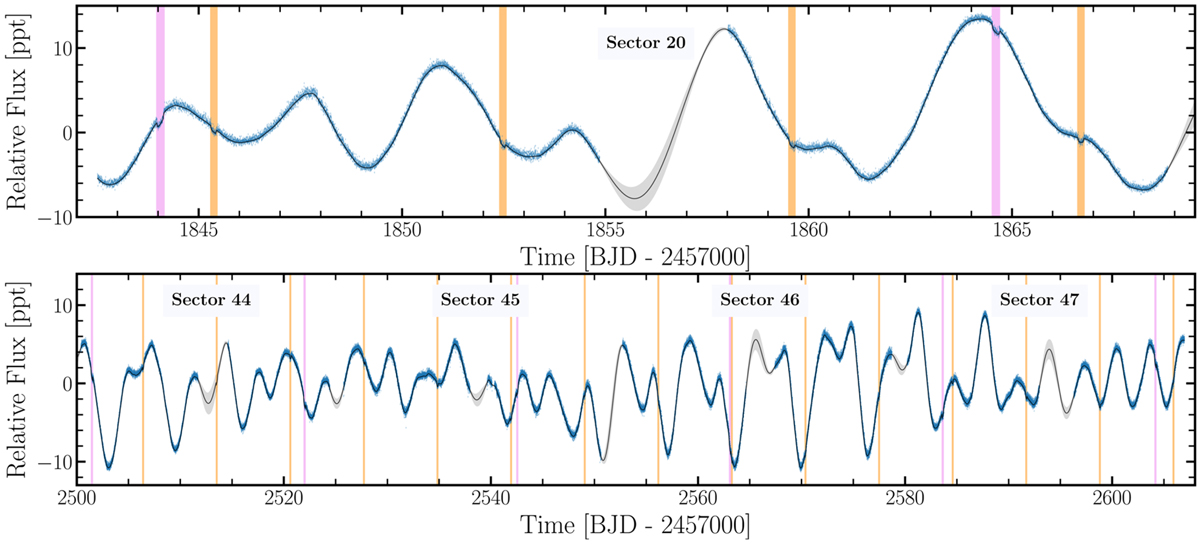
Light curves of HD 63433 for the five TESS sectors. The blue dots correspond to the PDCSAP flux data. The black line and the grey shaded region indicate the best model and its 1σ uncertainty, respectively. The vertical lines show the times of the planetary transits for HD 63433 b (orange) and HD63433 c (purple).
Current usage metrics show cumulative count of Article Views (full-text article views including HTML views, PDF and ePub downloads, according to the available data) and Abstracts Views on Vision4Press platform.
Data correspond to usage on the plateform after 2015. The current usage metrics is available 48-96 hours after online publication and is updated daily on week days.
Initial download of the metrics may take a while.